-

Qualtrics Platform -

Customer Journey Optimizer -

XM Discover -

Qualtrics Social Connect
Understanding Your Response Dataset (360)
About “Understanding Your Response Dataset”
For additional analysis outside of Qualtrics, you can download a dataset file for any 360 project. This dataset includes all your survey’s raw response data, including question responses, metadata, and more.
Rows
Every row in your 360 dataset is an evaluation. You will have a row for each evaluation completed for a subject, meaning you will see subjects and evaluators recur, so long as subjects have more than one evaluator, or evaluators have more than one subject.
Participant Information
StartDate and EndDate
The StartDate column indicates when the participants first clicked the survey link. The EndDate column indicates when the participants submitted their survey. If the entry is an incomplete response, this date will indicate the last time the participant interacted with the survey.
Status
The value in the Status column indicates the type of response collected. There are three main possible statuses:
- 32 / EX: A normal response
- 36 / Imported: An imported response
IPAddress
This column includes the subject’s IP address.
Finished and Progress
This Finished column details whether the response was submitted or closed. A “1” or “TRUE” indicates the participant reached an end point in their survey (e.g., hitting the last Next/Submit button, being screened-out with Skip or Branch Logic, etc.). A “0” or “FALSE” indicates the participant left their survey before reaching an end point and the response was instead closed manually or due to session expiration.
The Progress column shows the progress a participant made in the survey before finishing. For those marked as “1” or “TRUE” in the Finished column, the Progress is marked 100, regardless of whether they were screened out. For those whose responses are marked “0” or “FALSE,” you will get an exact percentage of how far they got in the survey based on what question they left off on.
Duration
The number of seconds it took the respondent to complete the survey. This is the entire duration of the response; if a respondent stops in the middle of the survey, closes the browser, and comes back another day, that time is counted.
Recorded Date
This column indicates when a survey was recorded in Qualtrics. For users taking surveys online, this date and time will be very similar to End Date. However, for responses that are imported, Recorded Date will often differ from End Date, instead reflecting when you manually uploaded the results, not when the survey taker finished.
ResponseID
The ResponseID is the ID Qualtrics uses to identify each response in the database. This identifier is provided as a reference and generally does not have a use in data analysis.
LocationLatitude and LocationLongitude
The location is an approximation determined by comparing the evaluator’s IP address to a location database. Inside the United States, this data is typically accurate to the city level. Outside the United States, this data is typically only accurate to the country level.
Metadata and Embedded Data
Any metadata saved to your participants and embedded data saved to responses will appear as data columns.
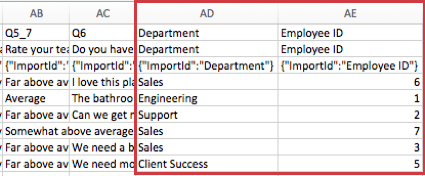
Only embedded data fields saved in the survey flow are included in the downloaded dataset.
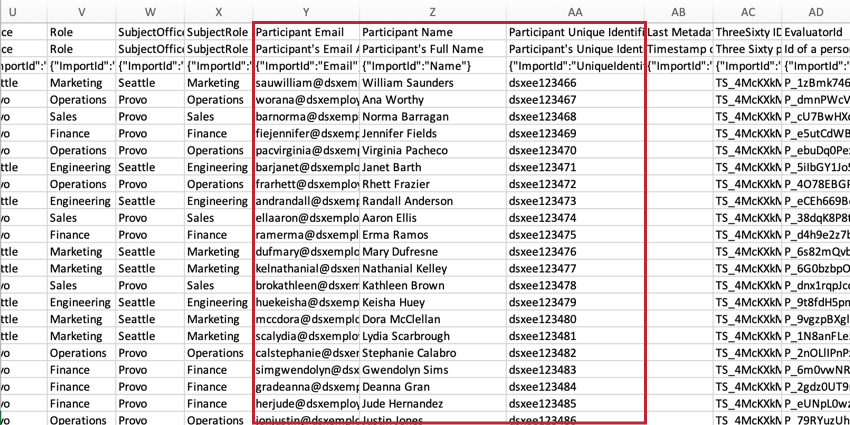
ParticipantName, ParticipantEmail, ParticipantUniqueIdentifier
The evaluator’s full name appears in the ParticipantName column in Last name, First name format. The ParticipantEmail is the evaluator’s email address. The ParticipantUniqueIdentifier is the evaluator’s unique ID.
Last Metadata Update Timestamp
The date and time the metadata was last updated. This time is shown in GMT (UTC+0), not your account’s time zone.
This column may also be called “Timestamp Of Last Metadata Update.”
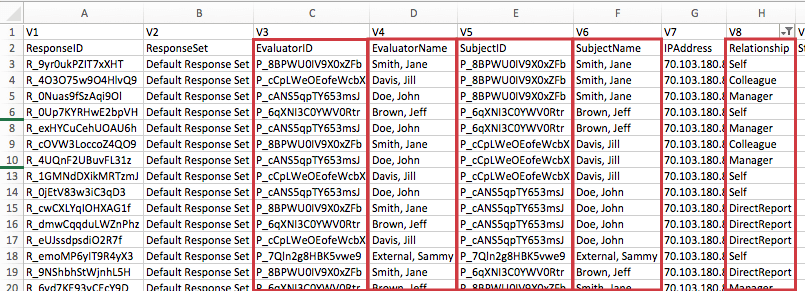
ThreeSixtyID, EvaluatorId, and SubjectId
All 3 of these IDs are internal IDs automatically generated by Qualtrics. The ThreeSixtyID is the 360 project ID, usually in the format TS_XXXX. The EvaluatorId is the person ID of the person who completed the evaluation (evaluator). The SubjectId is the person ID of the person who was subject of the evaluation (subject).
Relationship
The Relationship column contains the relationship between the subject and the evaluator. The relationship is shown as an exact relationship name, but you may also see this column being called “Id Of A Relationship Between Subject And Evaluator.”
You may also see a column called “Q_Relationship” or “Relationship Name In Survey Default Language” that shows the name of the relationship in the survey’s default language.
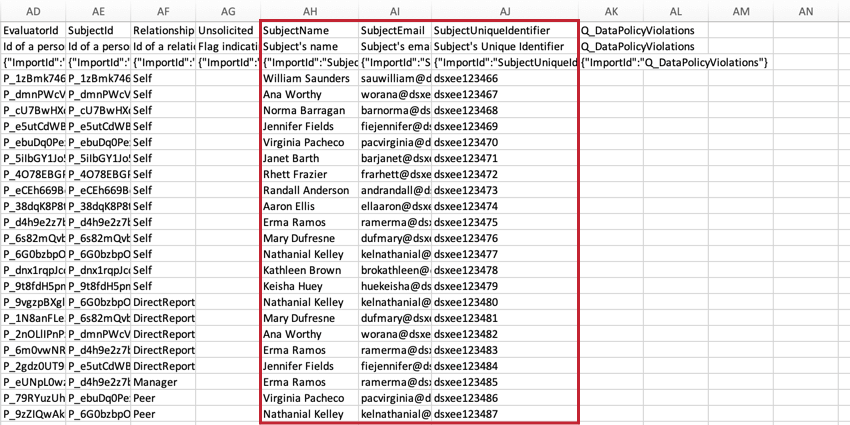
Unsolicited
There are participant options where any participant in the 360 project can leave an unsolicited evaluation for a subject, without being nominated as an evaluator by the subject, manager, or project admin. The Unsolicited column tells you whether an evaluation was unsolicited. The column will be blank if the response was not unsolicited.
This column may also be called “Flag Indicating If Evaluation Was Unsolicited.”
SubjectName, SubjectEmail, SubjectUniqueIdentifier
The subject’s full name appears in the SubjectName column in Last name, First name format. The SubjectEmail is the subject’s email address. The SubjectUniqueIdentifier is the subject’s unique ID.
Question Responses
Columns are headed with the question labels (Q1, Q2, etc.) and the beginning lines of the question text.
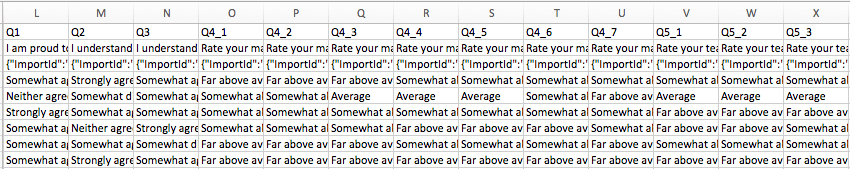
Question data is formatted the same in survey projects. See Question Responses for more detail on how this data is formatted.
Scoring Results
For surveys using Scoring, the score for each category is included in the dataset. Each scoring category gets its own column of data. In the example below, the survey only had 1 scoring category, called “Readability.”
This score is a sum of the points the respondent earned in the category, not an average.
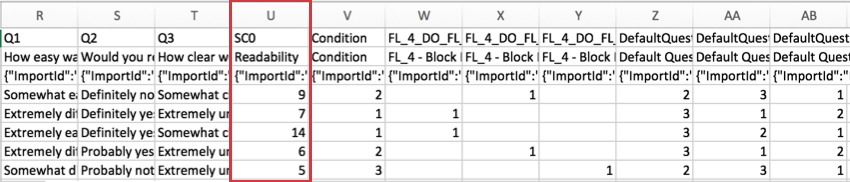
The “SC” in the header stands for “Scoring Category,” and the number represents the number category it is, counting up from zero. Because the example survey above has 1 scoring category, we see SC0, but if there were more, we would see SC1, SC2, and so on.
Randomization Data
If you randomized blocks or questions in your survey, then you’ll have randomization data available in your dataset.
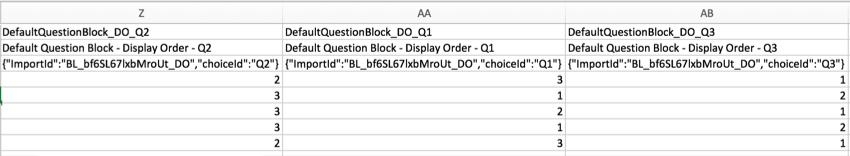
Data from randomized 360 projects is formatted the same as it is in survey projects. See Randomization Data for more detail on how to understand this data.
File Format Differences
Though all file types download the same data fields described above, each features a layout that may be slightly different. These are much the same as the the file formats available for the Survey Platform, so read the support page on different file types for Survey Platform exports for more detailed information.