-

Qualtrics Platform -

Customer Journey Optimizer -

XM Discover -

Qualtrics Social Connect
360 Reports Basic Overview
About the 360 Subject Reports
Subject reports are reports that contain the evaluation data for one subject. For example, John Doe’s subject report will contain data from his self evaluation, as well as his manager and peers’ evaluations of him, but it will not contain the evaluation John completed for his manager. However, other subjects’ evaluations can be included for comparison purposes.
Subject reports are usually only viewable by the subject and the Brand Administrators / Employee Insights administrators who edit and distribute the project. Through the use of special report options, managers can also be given access to their direct reports’ subject reports.
The subject report is one template that applies to all subjects. Any formatting changes you make to the subject report for one participant will apply to all other participants’ reports. This means you can build a standard report quickly without worrying about having to manually apply it to every individual participant.
Major Components of a Subject Report
In this section, we’ll cover the major components that comprise a subject report, in order of importance.
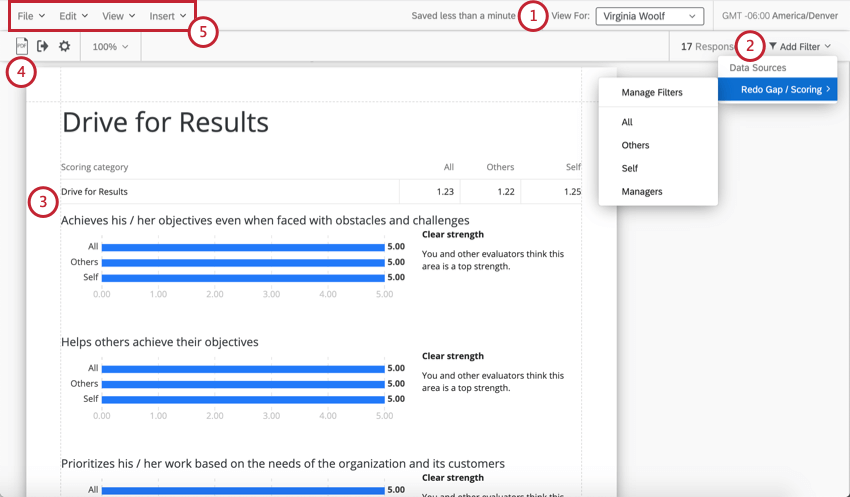
- Switching between subjects: In the upper-right of the subject report, you can switch between subjects’ data using the View for dropdown. This can help you determine whether the changes you’ve applied look good on all subjects’ reports. This can also help you determine whose data to preview or export.
Qtip: There is no John Doe data. However, if you haven’t collected data yet, you can always add yourself as a subject, add one or two demo evaluators, and complete the 360 survey.
- Filters: This is where you’ll find your rater filter groups, among other filters. This is where you can define the relationships you’ll use to break out the subject’s data or compare how different groups rated the subject. By default, we provide you with a few rater groups to get started.
Example: See how the chart in this screenshot shows average scores provided for the subject. These scores are split out by all evaluations, the self-evaluation, and other evaluations (evaluations of the subject excluding the self-evaluation).
- Visualizations: The charts and tables you use to display data in your report. There are many different kinds of visualizations, each with its own support page to describe its options and what kind of data it’s best equipped to visualize. Each page can have up to 20 visualizations with data. See New 360 Reports Visualizations.
- Exporting subject reports: Although we advise subjects to access their own reports using their participant portal, you can also export any subject’s report as a PDF right inside the report. See Sharing 360 Reports for more information.
- Toolbar: This tool bar can help you build and personalize your reports. Edit global report settings, insert visualizations and other content, and more. See Report Toolbar (360).
Creating Your Subject Report
You will have the option to create this report from a template, from scratch, or from the QRF of another “new report” you made for a past 360 project. Be careful how you choose to create this report, because you will not be able to delete this report or start over. You can always continue to edit your report and to add and remove content as needed, but you will not be able to delete the entire report at once or start over using a template or QRF.
- Select the Reports tab.
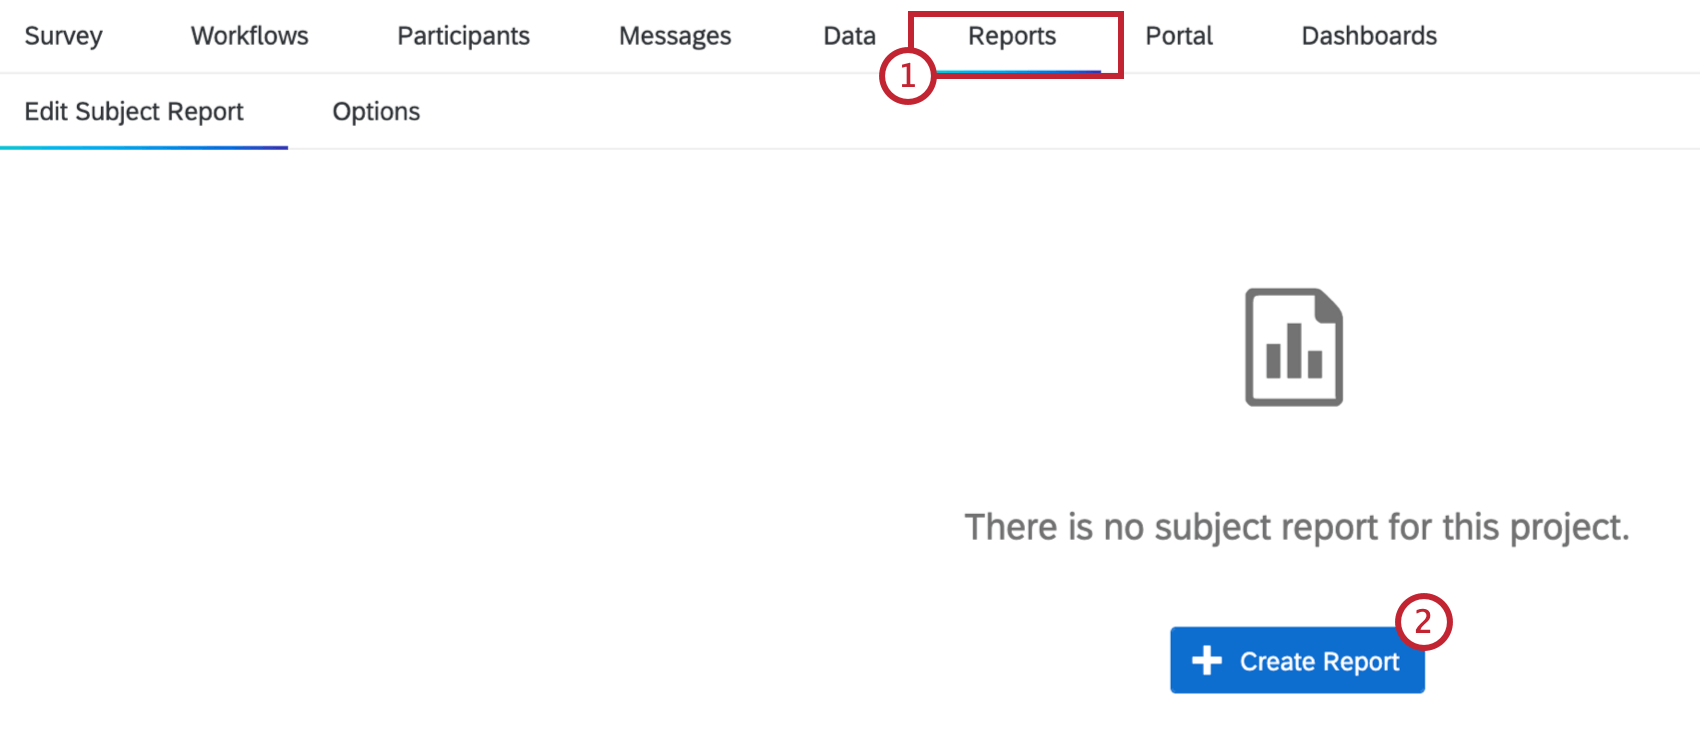
- Click Create Report.
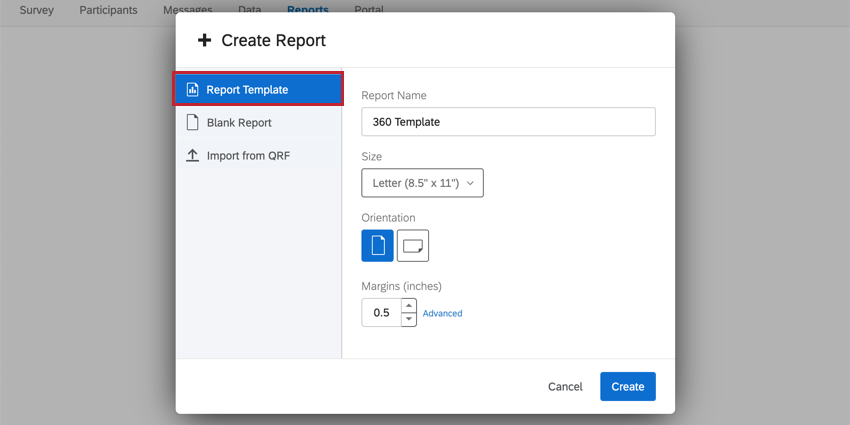
- You must select between the following 3 options. We highly recommend selecting the Template.
- Template: Start from a template created by Qualtrics. The report will come with a cover, an explanation of how to read the report, a response summary, and then page devoted to each of the following: gap chart, agreement chart, high and low scores, hidden strengths / improvement areas, and scoring overview.
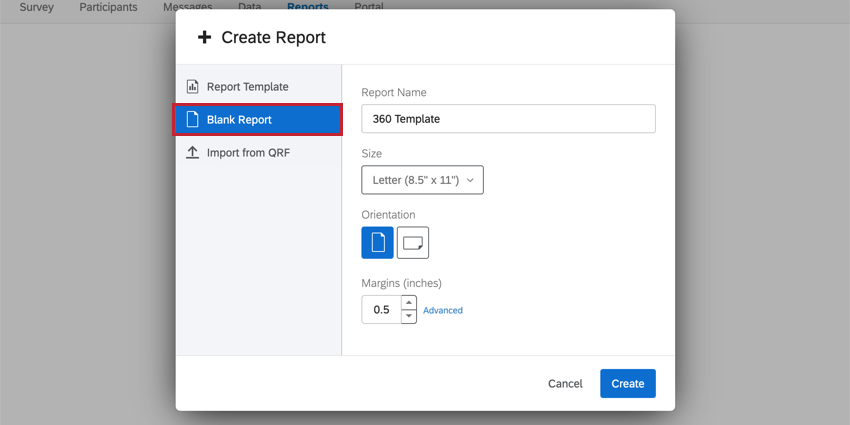
- Blank Report: Start a blank report entirely from scratch.
- Import from QRF: Import a Qualtrics Report File (QRF) from a previously made 360 report to carry over all settings and visualizations. See Creating a Subject Report from a QRF for more information.
- Template: Start from a template created by Qualtrics. The report will come with a cover, an explanation of how to read the report, a response summary, and then page devoted to each of the following: gap chart, agreement chart, high and low scores, hidden strengths / improvement areas, and scoring overview.
- Name the report and verify its initial page layout settings (e.g., Page Size, Orientation, and Margins).
- Click Create to continue.
Qtip: You can change the page layout settings later in the Page section of your Global Settings.
Creating a Subject Report from a QRF
We recommend using this option if you run a 360 project with relatively similar questions year to year, and want to reuse a previous subject report in a new 360 project.
- Go to the Reports tab in a past 360 project with a report that you’ve already built.
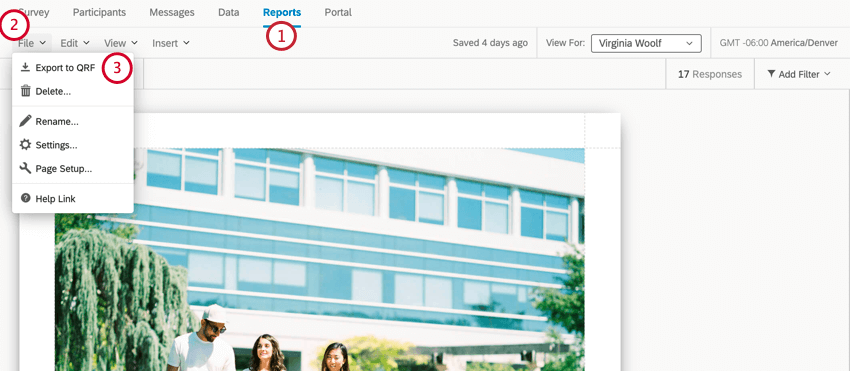
- Click File.
- Choose Export to QRF.
- Return to the Reports tab of your current 360 project.
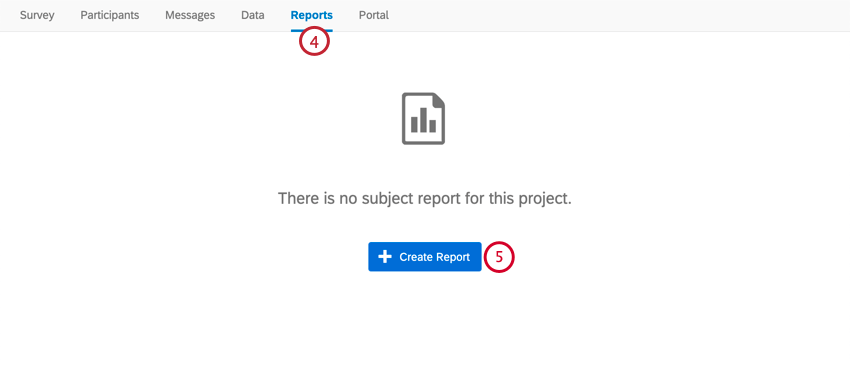
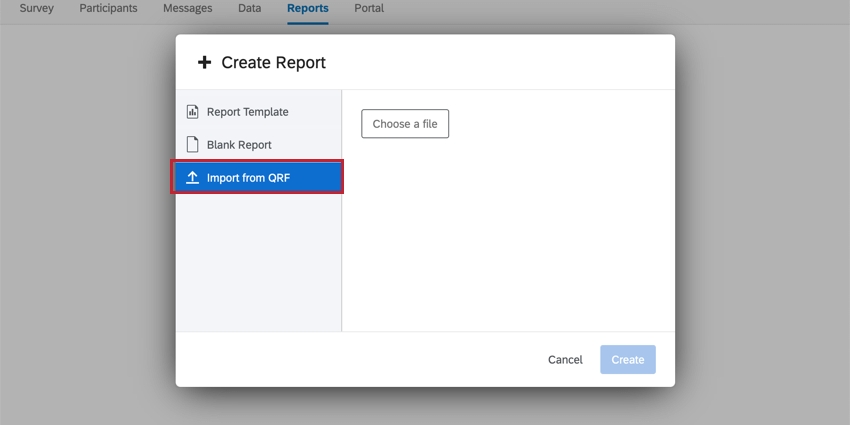
- Click Create Report.
- Select Import from QRF.
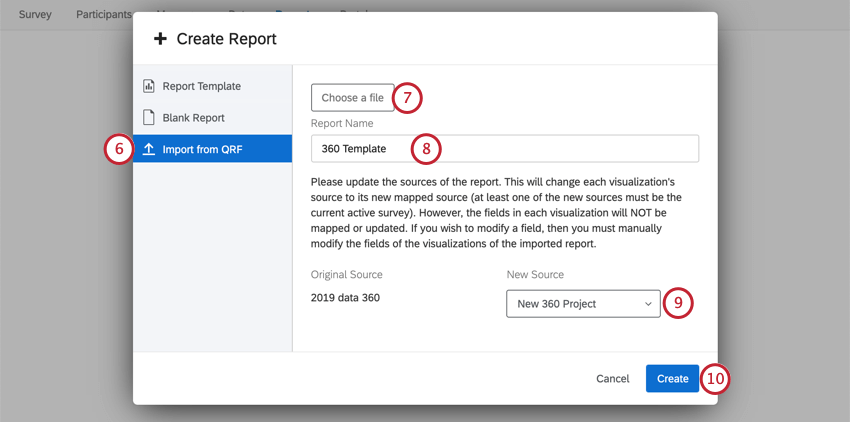
- Click Choose a file and select the downloaded QRF on your computer.
- Give your file a name.
- This is the survey that the report will pull the data from. Select the 360 project that you are working in / that you want to use the template with.
- Click Create.