-

Qualtrics Platform -

Customer Journey Optimizer -

XM Discover -

Qualtrics Social Connect
Scales (EX)
About Scales
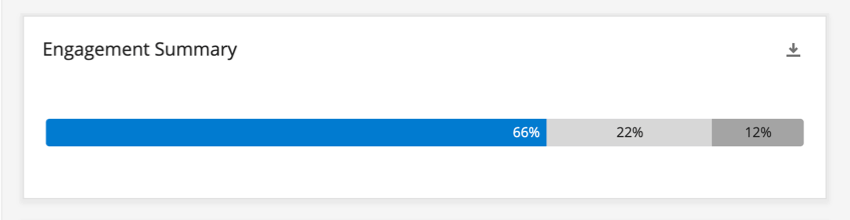
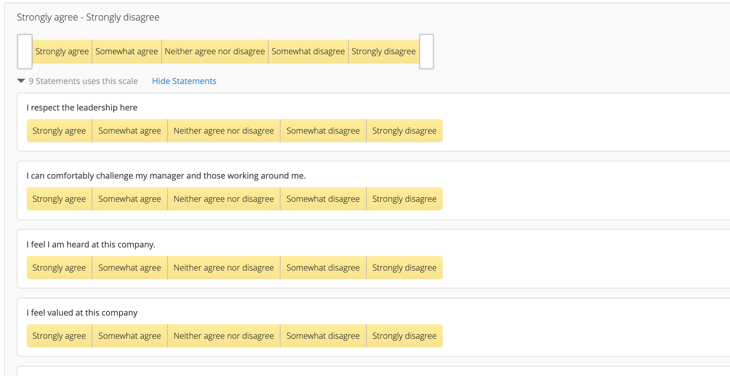
Many widgets display participant engagement and category scores through the use of colorful scales. Each color indicates favorability, which is used to calculate the engagement scores. In the example below, 67% of the participants gave favorable ratings on the engagement scale selected.
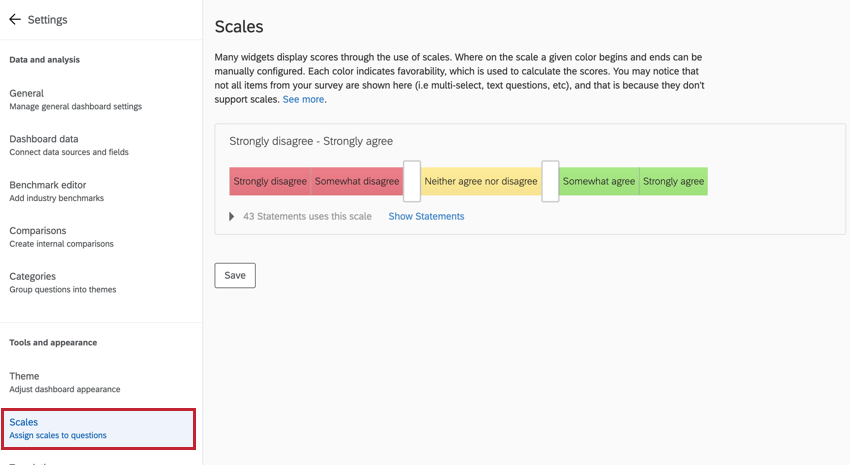
How each answer to a question falls on these scales can be unique to your survey. Navigate to the dashboard’s Settings and select the Scales section on the left to get started.
Preparing Data for Scales
Only number set fields can be set up as dashboard scales.
Fields must be mapped to your primary data source before you can use them in scales. Your primary data source is the first and default data source in your dashboard.
If your dashboard has multiple data sources, this is compatible with scales. However, it’s important to keep the following in mind:
- Scale fields are always determined by the primary data source. You can’t define a scale that only exists in one of your additional data sources if it’s missing from the primary.
- Make sure matching fields are mapped together on the same row in each source. See more on mapping additional sources.
- If you’re mapping the same question across multiple sources, it needs to have the same number of scale points in each survey. For example, if you ask employees to rate their confidence in their training from 1-5 in your first survey, they cannot rate their training from 1-7 in another survey.
How to Change Your Scales
Open the Scales page in your dashboard settings.
Click the arrows on the white sliders to adjust which scale points correspond to which colors, then click Save.
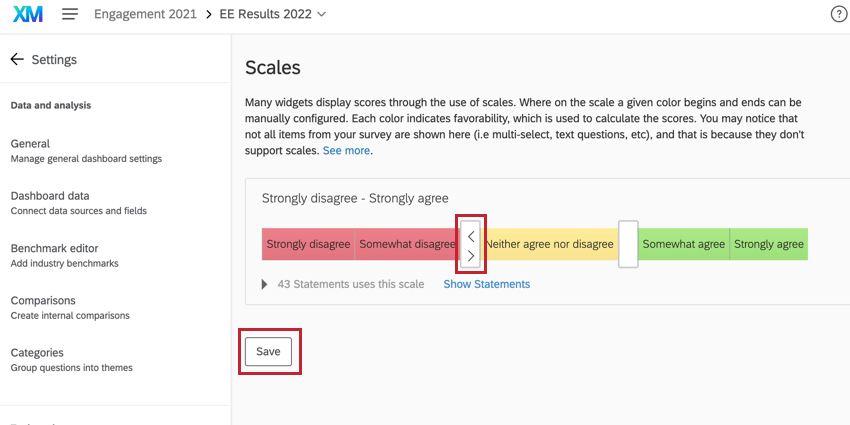
As a rule, the color on the far left indicates low favorability, the color in the center indicates neutrality, and the color on the far right indicates favorability. This affects the percentages calculated in the compatible widgets listed below.
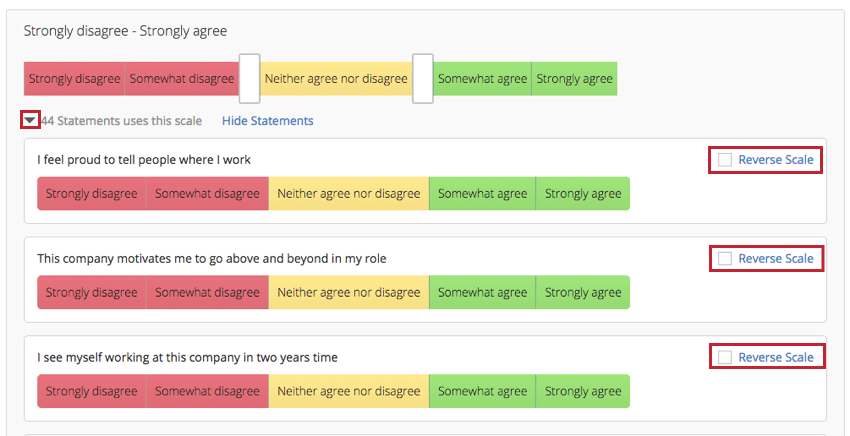
Reverse-Scale
If you have questions with scales that are reverse-coded, click the dropdown arrow to reveal the different scale points, then select Reverse Scale next to each question that uses a reversed scale. This setting is especially helpful when configuring categories.
If you have mapped more than one source to your dashboard, these sources will share the same scale. You cannot set a different scale for your historical data sources.
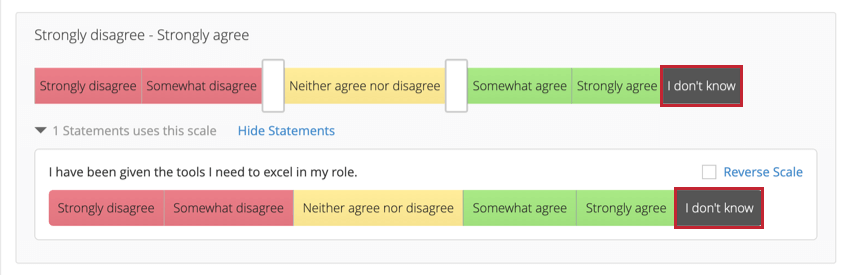
Answers Excluded from Analysis
Sometimes scales have an option, such as “Not applicable” or “I don’t know,” that shouldn’t be included in the scale calculations. Choices that are excluded from analysis will appear as dark gray segments.
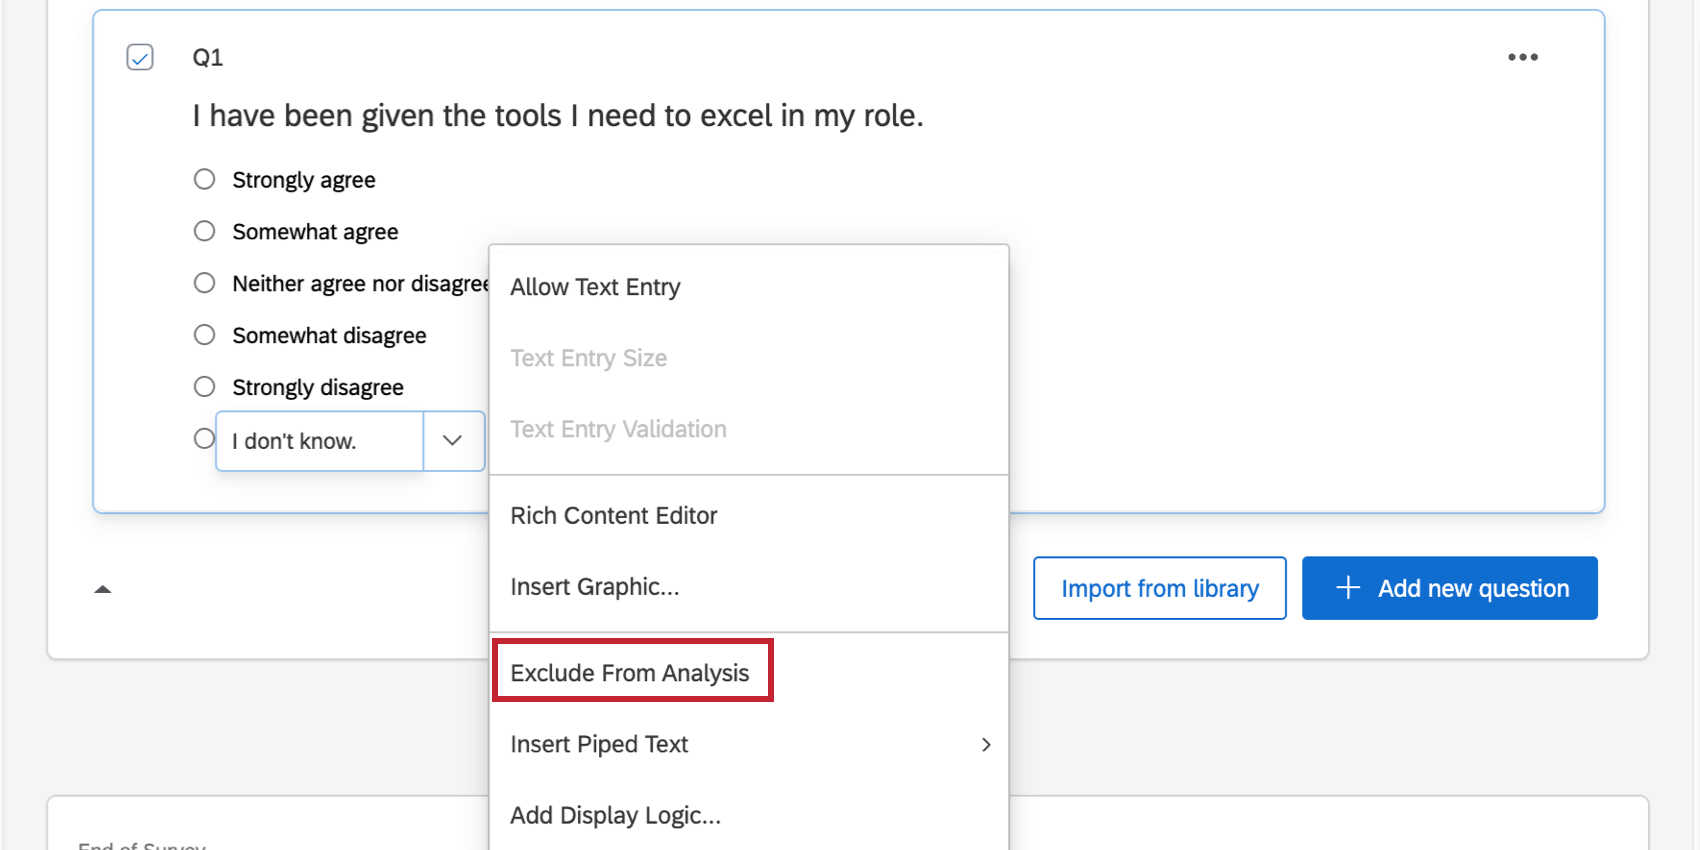
Many phrases, such as “Not applicable” and “I don’t know,” will automatically exclude the choice from analysis. But if you’d like to reverse this, or if you think a scale point should be excluded when it isn’t already, go to the Survey tab and use the answer dropdown.
Widget Compatibility
The following widgets use these scales:
- Engagement Summary Widget
- Scorecard Widget
- Comparison Widget
- Participation Summary Widget
- Heat Map Widget
- Demographic Breakout Widget
- Question List Widget
- Bubble Chart Widget
Error Messages & Troubleshooting
You may encounter a few different error messages when setting up your dashboard’s favorability scales. These errors are built to preserve your data’s integrity and prevent incorrect analysis of engagement results. Below is a list of common error messages, their causes, and how to fix them.
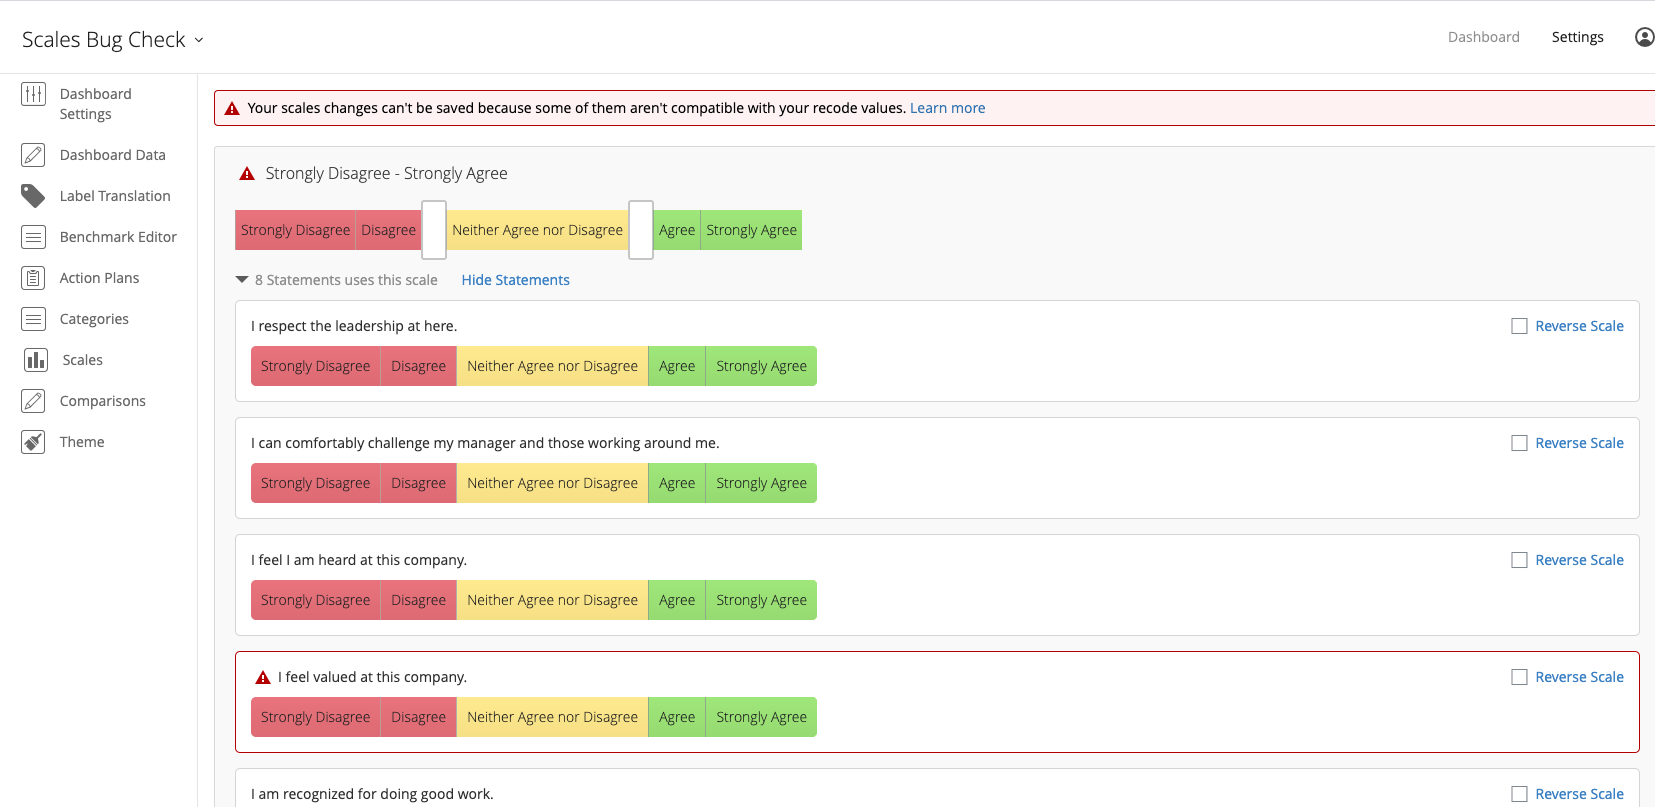
-
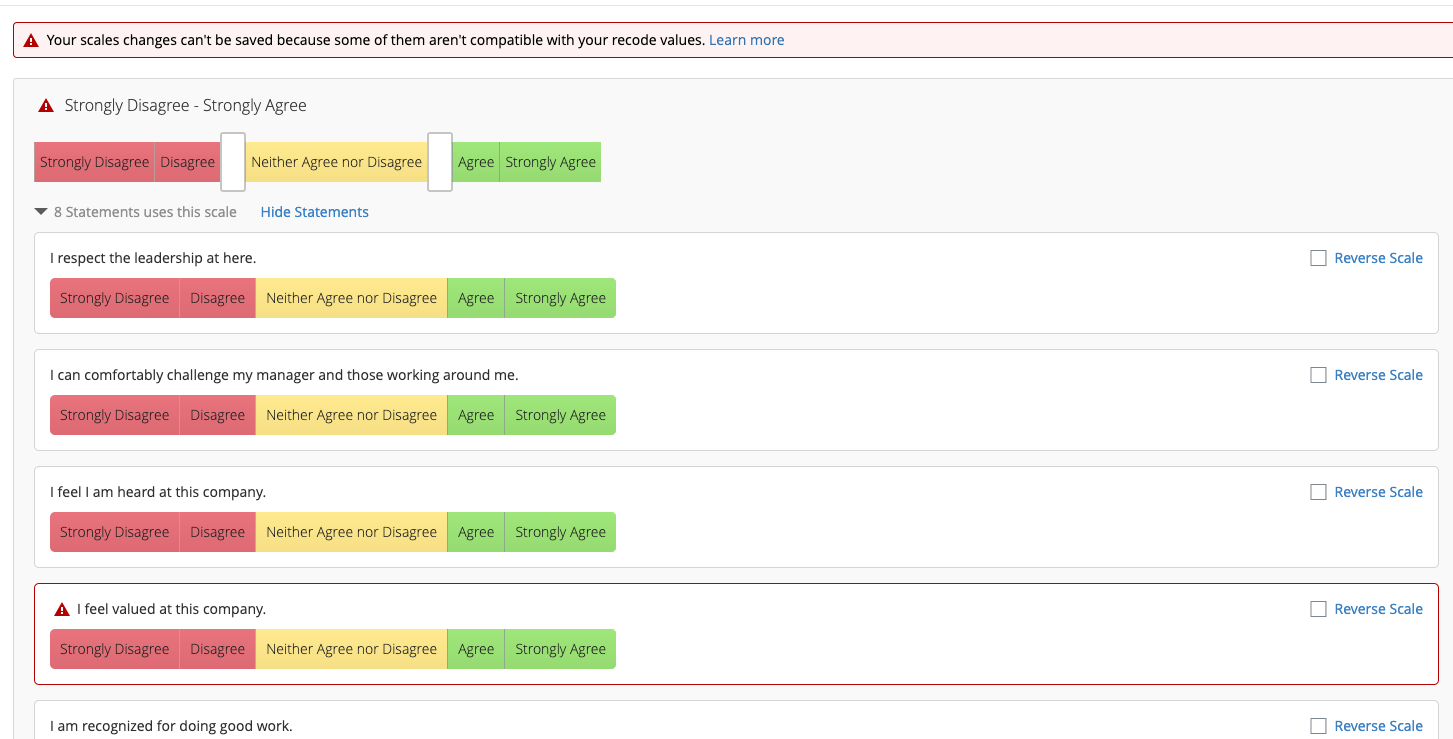
- Your scales changes can’t be saved because some of them aren’t compatible with your recode values. This error message appears when you try to save a scale that contradicts your recode values. For example, if two points on your scale have the same recode value, they must have the same favorability on your scale. The scales editor will tell you which scales and fields are invalid by marking them with a red triangle. To fix this, you will need to recode your fields so that the scale points have different recode values. The same error can happen when your scale points don’t form a progressive set (i.e. they aren’t continuously increasing or decreasing), see the recode values troubleshooting section for more details.
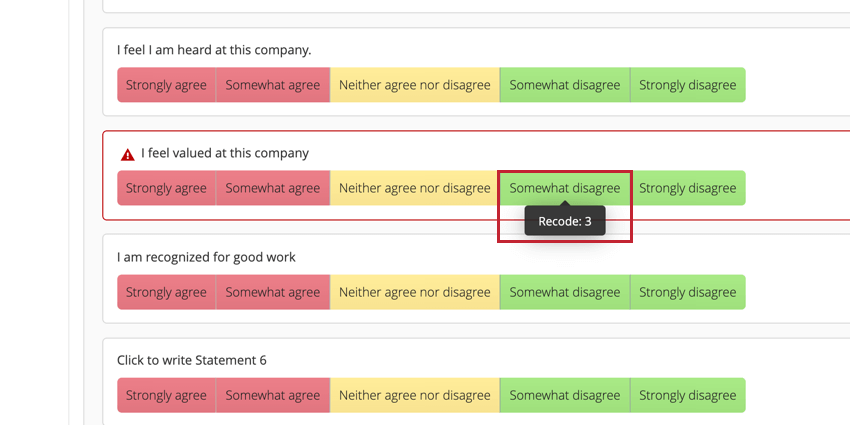
 Qtip: Hover over a scale point to see its recode value.
 Attention: If you want to see what items are invalid, you will need to save your Scales to have the items appear.
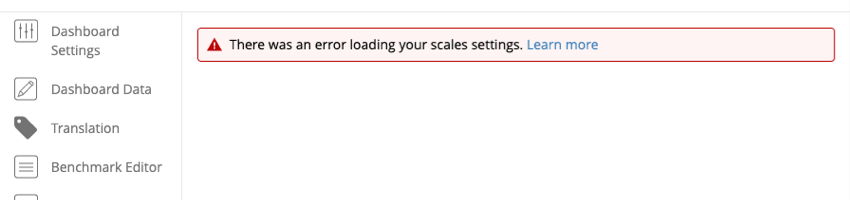
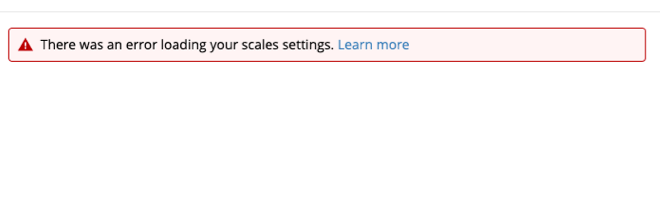
 - There was an error loading your scales settings. You may see this message if the fields in the Data Mapper are misconfigured, or if you have any questions in your survey that use carry forward or default choices. These features are not supported in scales.
- All scales are neutral upon dashboard creation. While rare, this scenario occurs when the recode values in the survey editor would create invalid scales. When you create your dashboard, all of your scales will be neutral. There are two different ways you can fix this issue. If you haven’t yet built your dashboard, we recommend recoding the questions in your survey editor and then creating a new dashboard so that the scales auto-generate. You can also recode your fields in your dashboard data and then manually create your scales, but this method takes longer and is more work.
- This dashboard contains invalid scales. Go to the Scales tab in Dashboard Settings and fix any scales with errors. This message is only visible to dashboard admins. This error message appears on old dashboards to indicate the dashboard is on a legacy version of scales. As long as the scales in the scales editor are valid, click Save at the bottom of the scales editor to migrate the dashboard to the new version of scales and resolve these error messages.
- If your historical data source contains fields that are on a different numeric scale than your primary source, you’ll need to recode your historical data to match your primary data. For example, let’s say last year’s engagement project had a question on a 7-point scale. If this year’s engagement project has the same question on a 5-point scale, the historical data will need to be recoded to the 5-point scale so that it aligns with the current project’s scale.
- If you see other errors or recode values that don’t match what you expected, you may want to try deleting and re-entering the field in the data mapper.
Warning: Deleting and re-entering a field in the data mapper will cause a dashboard recache. The recache can take longer for larger dashboards.
- Your scales changes can’t be saved because some of them aren’t compatible with your recode values. This error message appears when you try to save a scale that contradicts your recode values. For example, if two points on your scale have the same recode value, they must have the same favorability on your scale. The scales editor will tell you which scales and fields are invalid by marking them with a red triangle. To fix this, you will need to recode your fields so that the scale points have different recode values. The same error can happen when your scale points don’t form a progressive set (i.e. they aren’t continuously increasing or decreasing), see the recode values troubleshooting section for more details.