-

Qualtrics Platform -

Customer Journey Optimizer -

XM Discover -

Qualtrics Social Connect
Manual Fields
About Manual Fields
You can add new custom fields to responses even after they’ve already been recorded, enhancing your data and reports. You can add any custom information you want, whether in text, date, numeric, and even multi-answer format. Custom fields can be a great alternative if you didn’t set up branch logic with embedded data fields before launching the survey.
Kinds of Manual Fields
- Date: Record exact date information for your responses. In reports, these can be used in date filtering, allowing you to set timeframes you’re interested in presenting on or researching.
- Numeric: Enter numeric data with no other symbols, such as commas, slashes, or currency signs ( $ ). Decimals are supported.
- Text: Accepts any text, number, or symbol characters. This option can be great for either detailed notes or categorical data.
- Tags: Categorize data with short tags. You can add multiple tags to the same response.
Creating a Manual Custom Field
- Go to Data & Analysis.
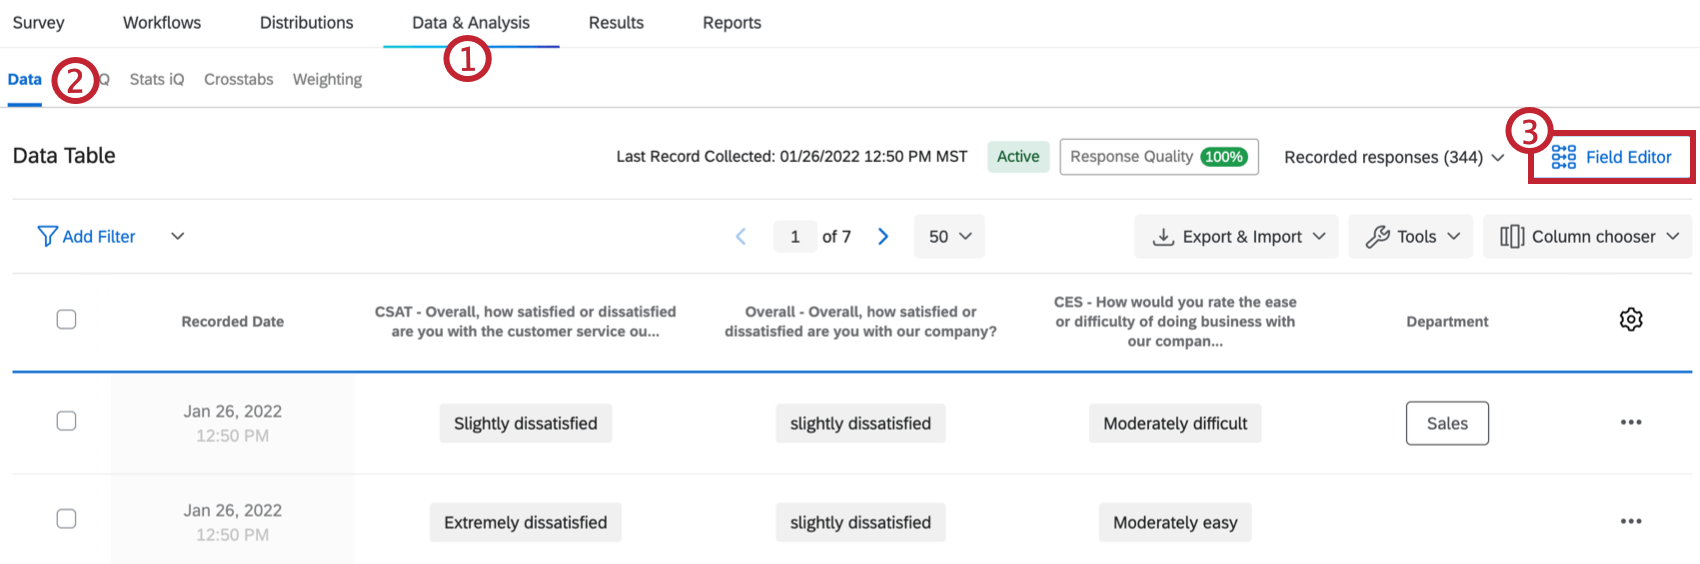
- Make sure you are in the Data section.
- Select Field Editor.
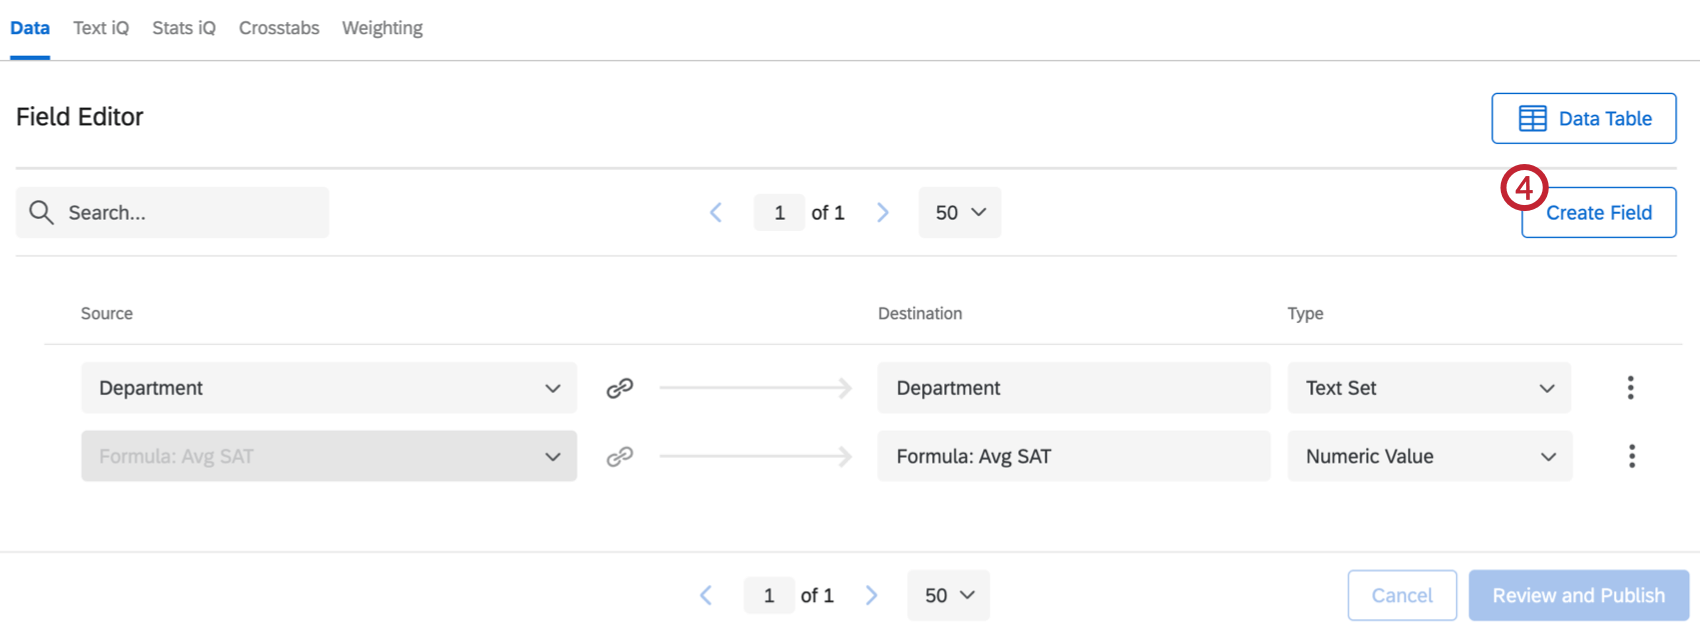
- Click Create Field.
- Choose Manual.
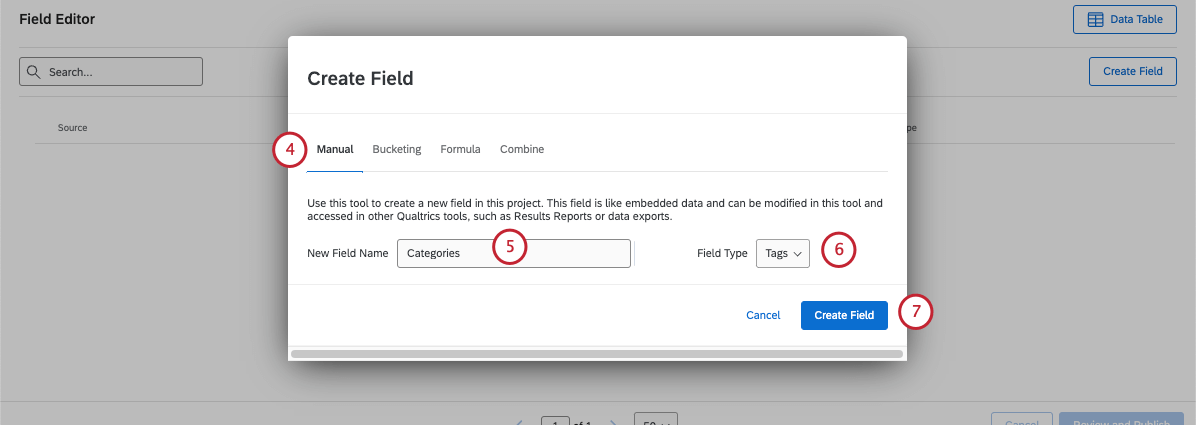
- Add a name for your field.
- Choose a field type. See our list of manual fields.
- Select Create Field.
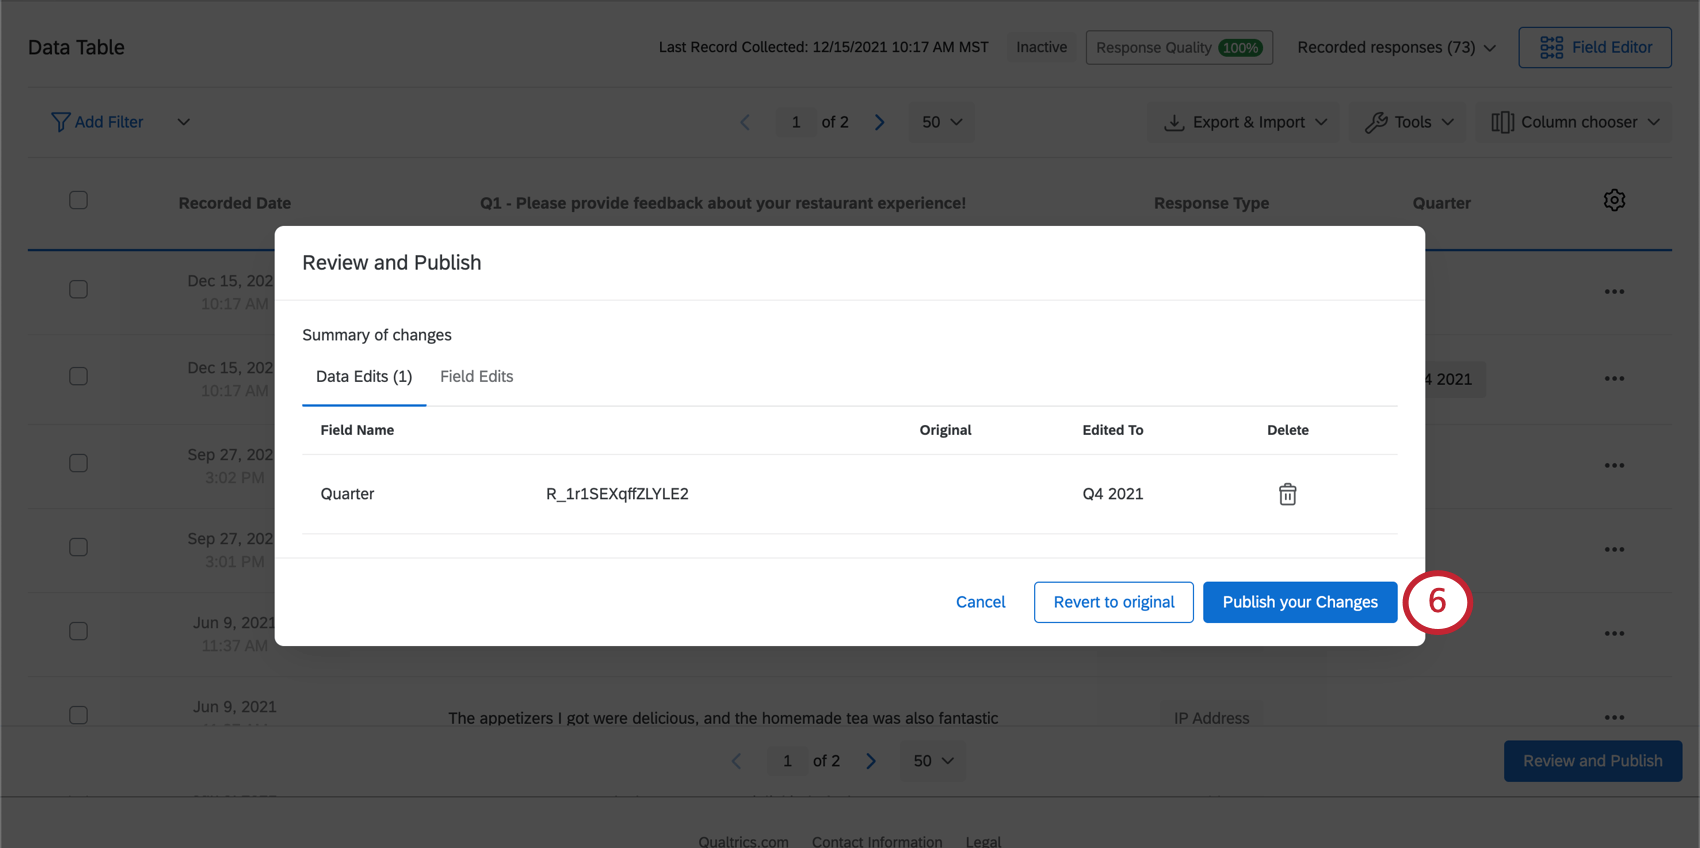
- Click Review and Publish.
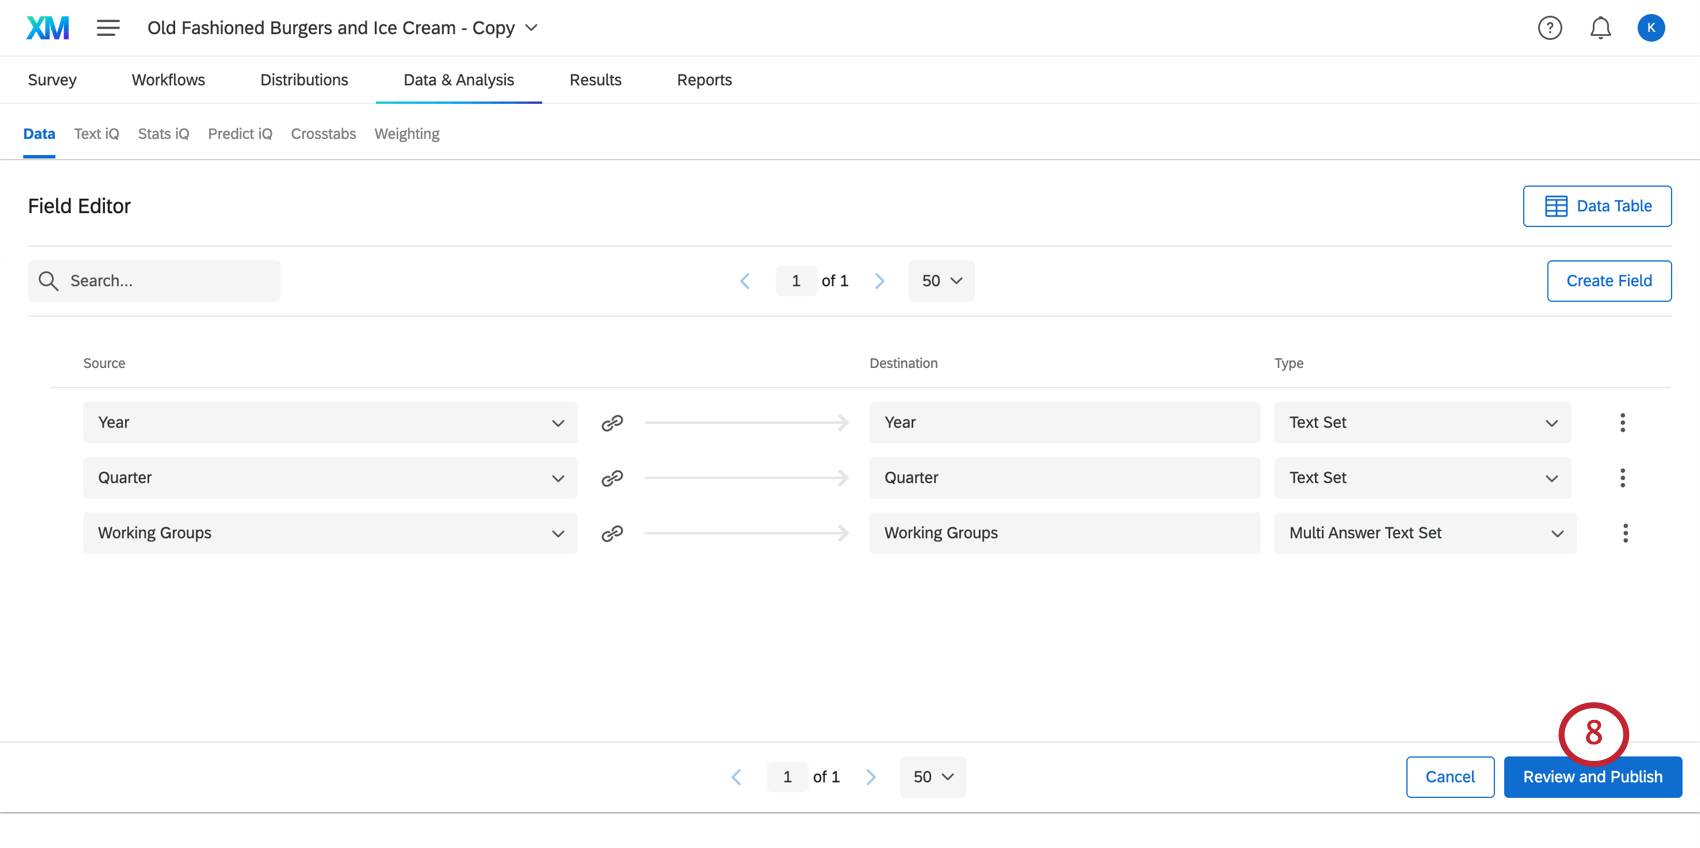
- Click Publish your Changes to save your new field.
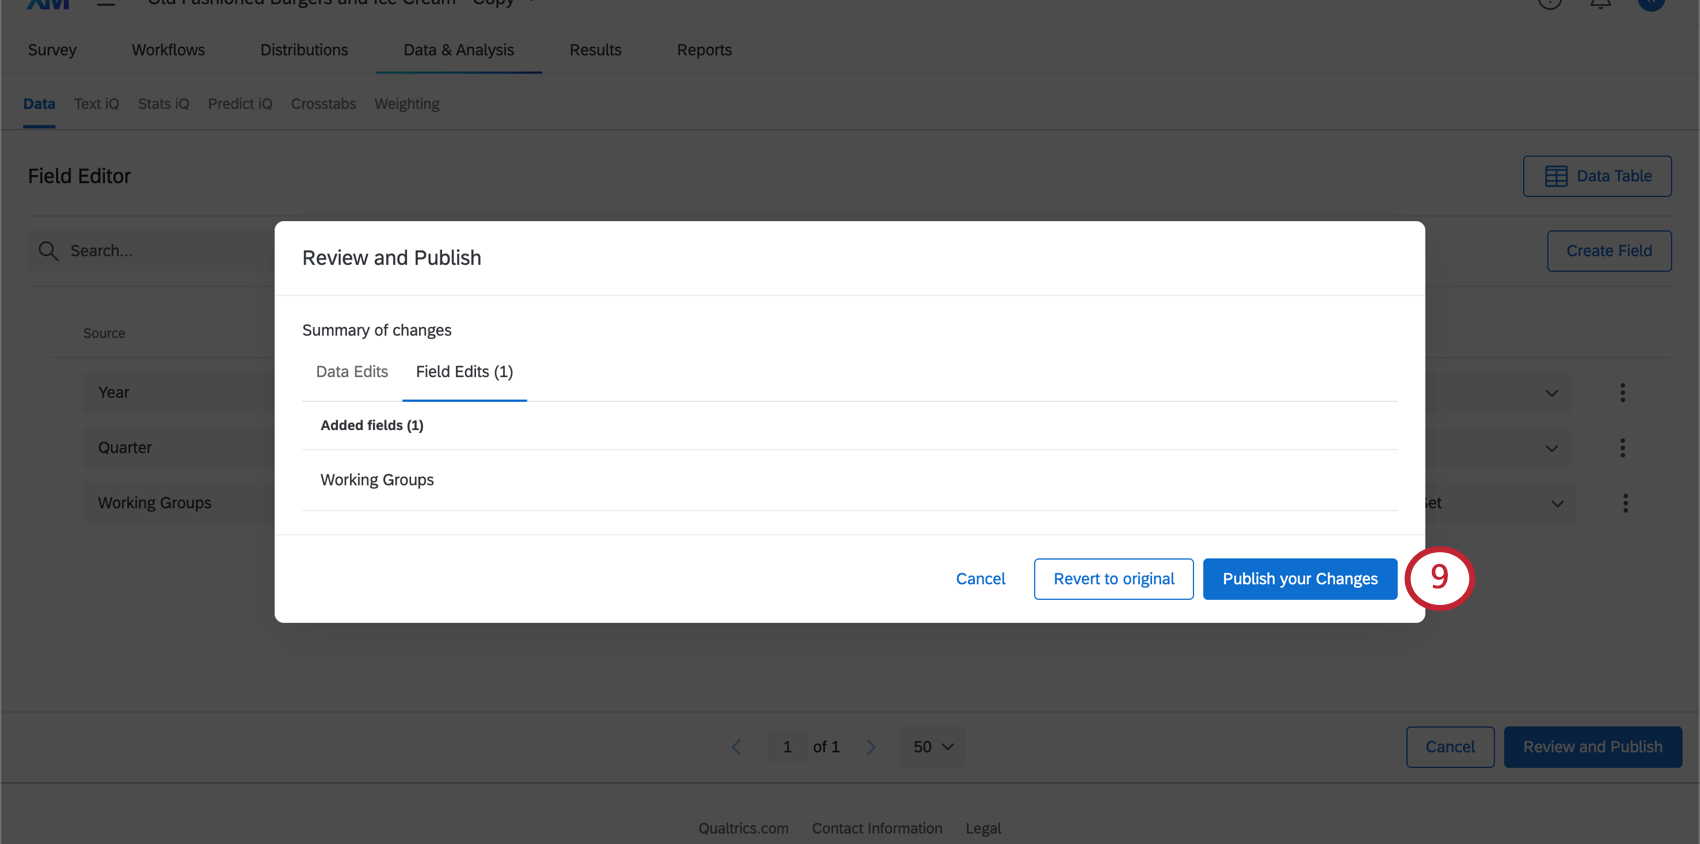 Qtip: You can also select Revert to original to revert your field edits.Qtip: It may take some time before your dataset is finished updating. It is safe to leave this page while you wait.
 - Now you can add values for a response or multiple responses at once.
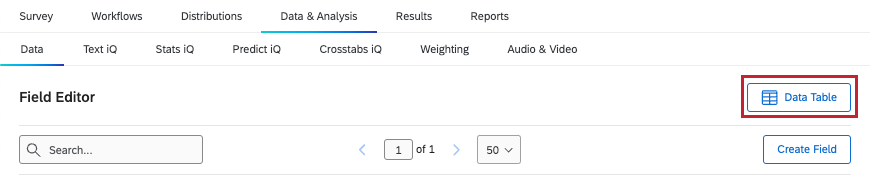
Qtip: Before you add values, you need to go back to your response data. If you haven’t been taken back automatically, click Data Table.
Assigning a Value to a Manual Field
Now that you’ve created your field, it’s time to set its values. In this section, we’ll show you how to can change the value of your new manual field in one response at a time.
- Navigate to the Data & Analysis tab.
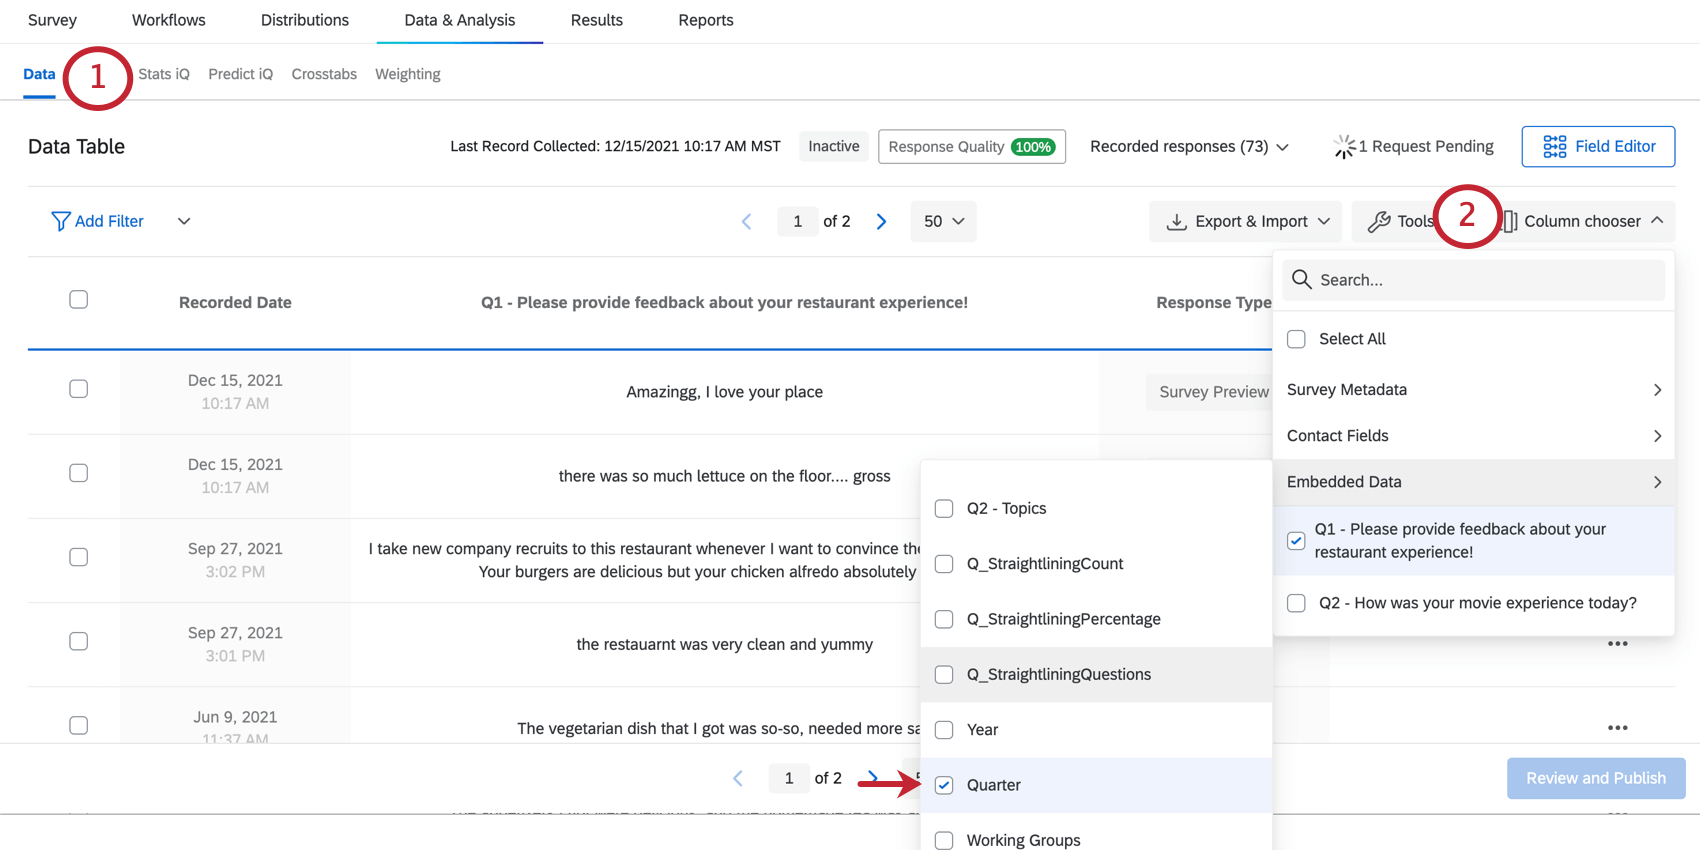
- Choose columns, look under Embedded Data, and make sure to display the field you just created.
- Find the response you want to edit.
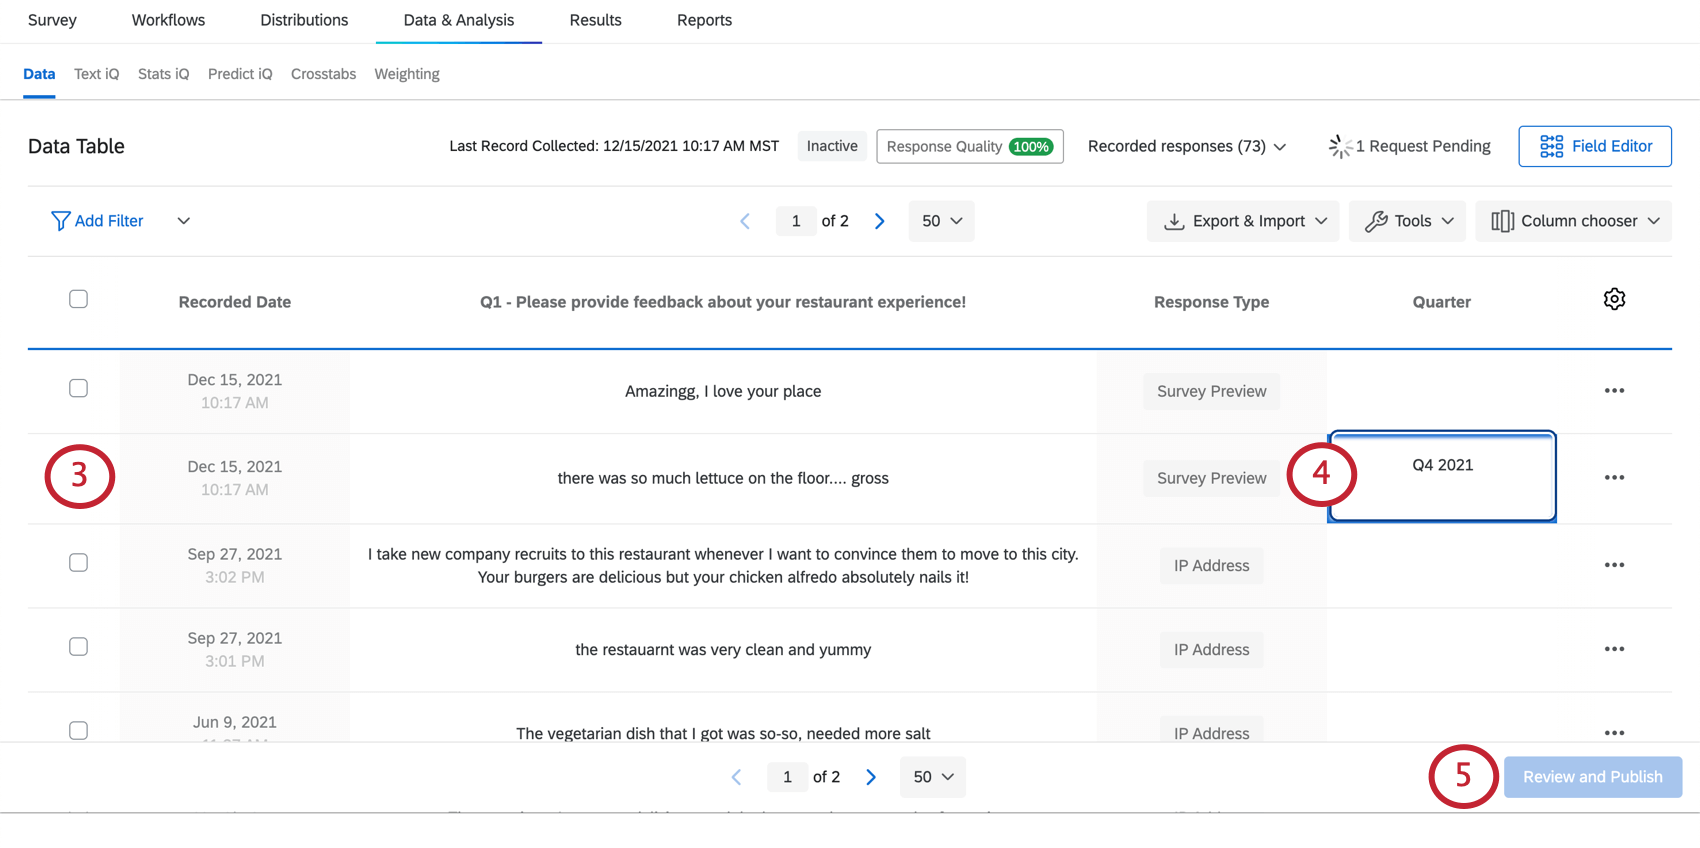 Qtip: You can do this by manually navigating through pages or filtering your data.
 - Type in the desired value for each response.
Qtip: Hitting Tab or Enter (Windows) / return (Mac) twice will move your cursor to the next field box immediately below.
- Click Review and Publish.
Qtip: You may need to click somewhere outside of the field you just edited before this button will become clickable. For example, click the whitespace on the footer of the page, or click the browser’s scrollbar.
- Click Publish your Changes.
Assigning a Value for Multiple Responses at Once
Now that you’ve created your field, it’s time to set its values. In this section, we’ll show you how to can change the value of your new manual field in many responses at once.
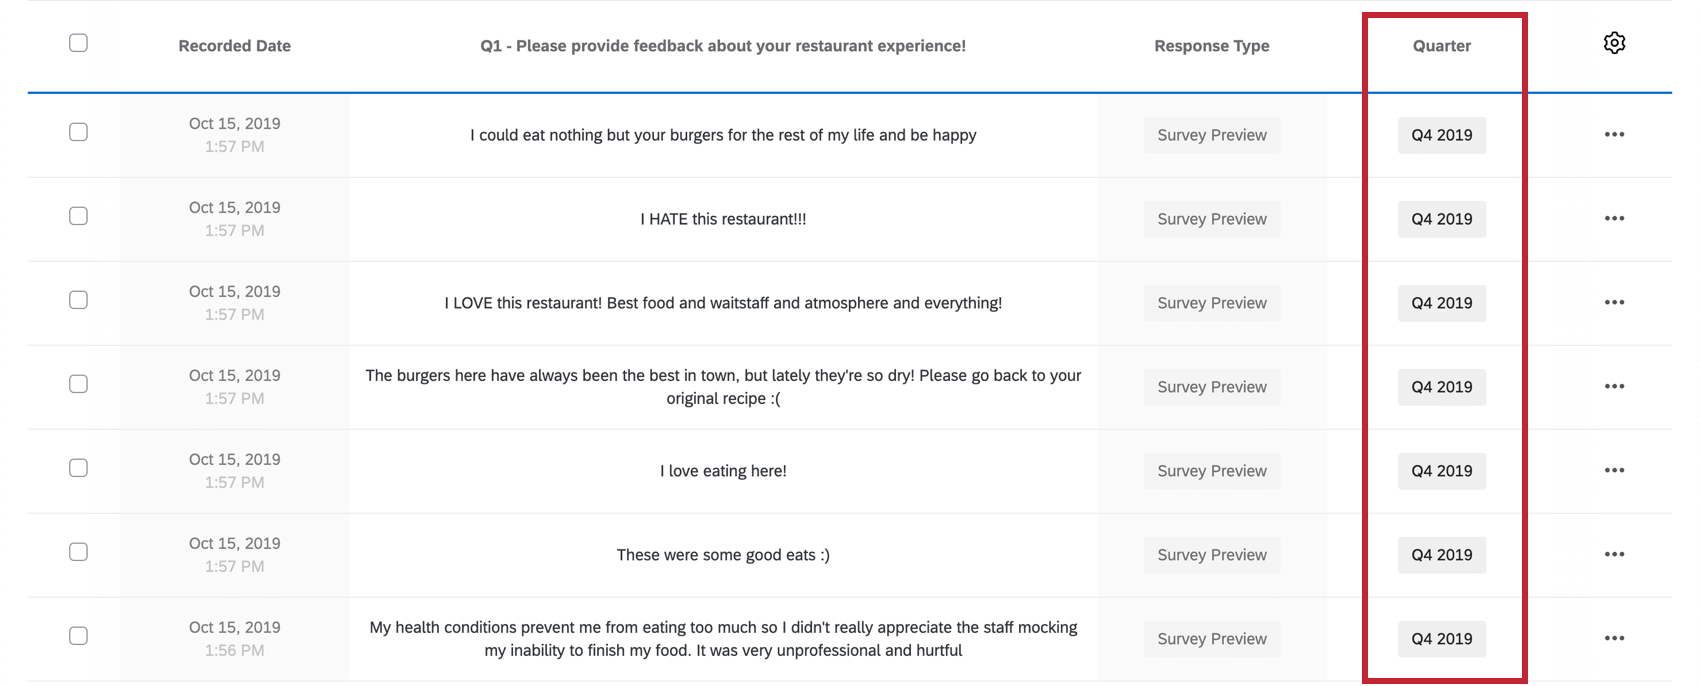
This method is best for giving many responses the same value at once. For example, finding all of the responses recorded in 2024 and tagging a “Year” field as “2024” for all of them.
- Navigate to the Data & Analysis tab.
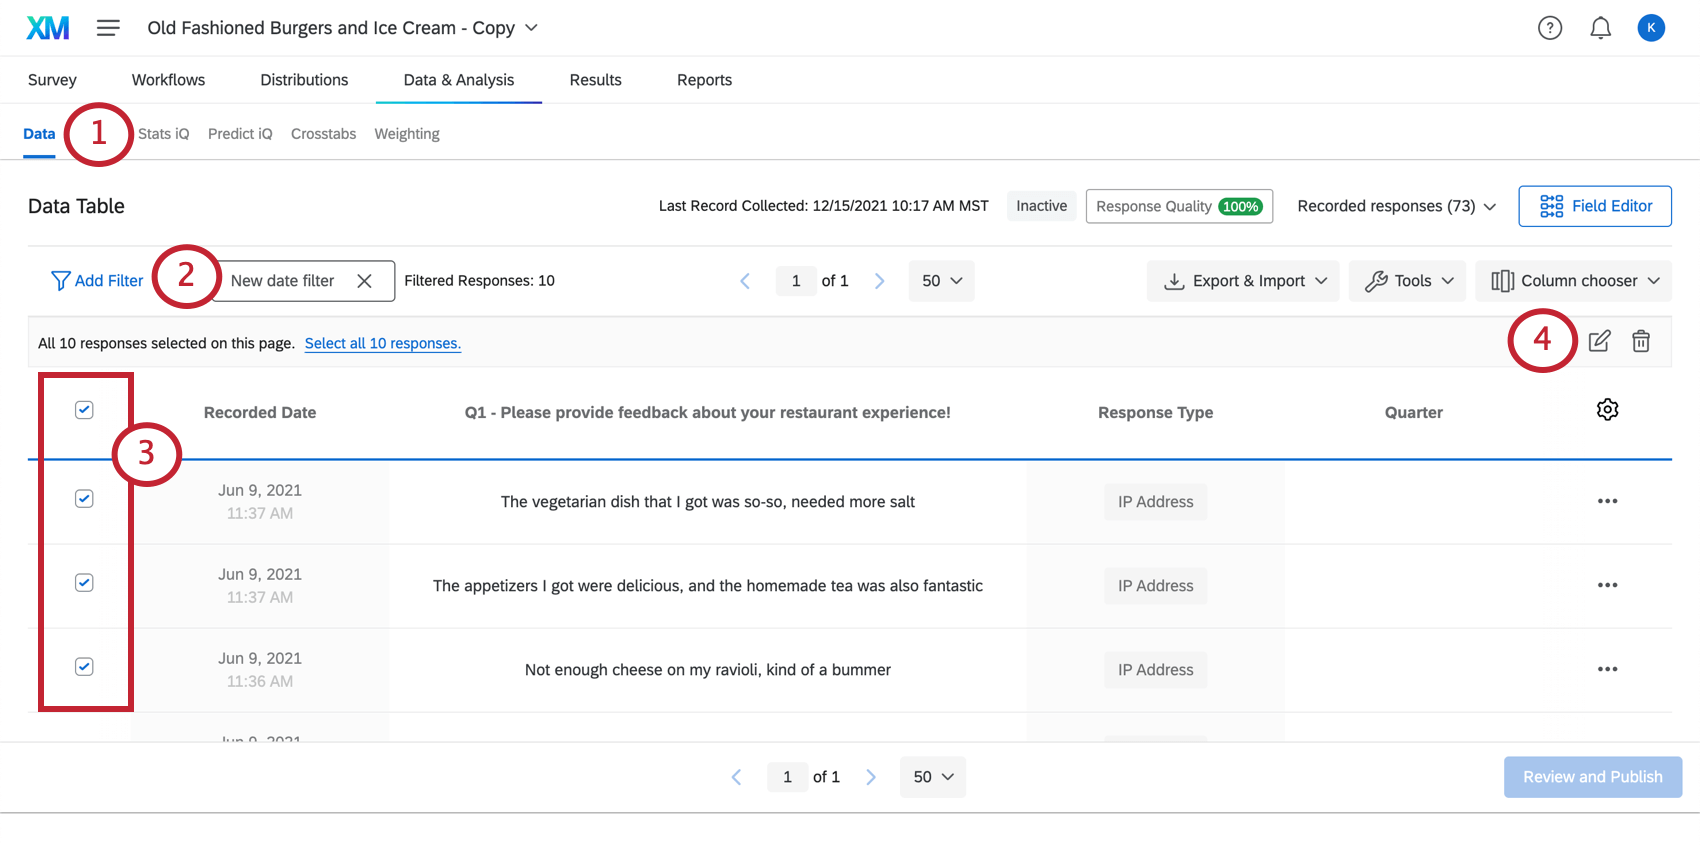
- If you want, you can filter for the responses you want to edit.
Example: Filter for all responses collected between January 1, 2020 and December 31, 2020 to tag them with the same label all at once.
- Select the responses you want to edit.
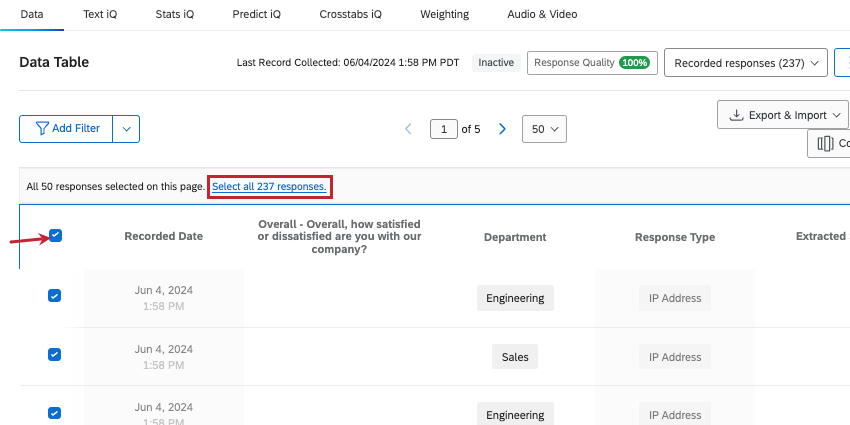
Qtip: If you click the “select all” checkbox and have multiple pages of responses, you can select all the responses on additional pages by clicking Select all X responses.
- Click the edit icon.
- Under Field Name, select the field you want to edit.
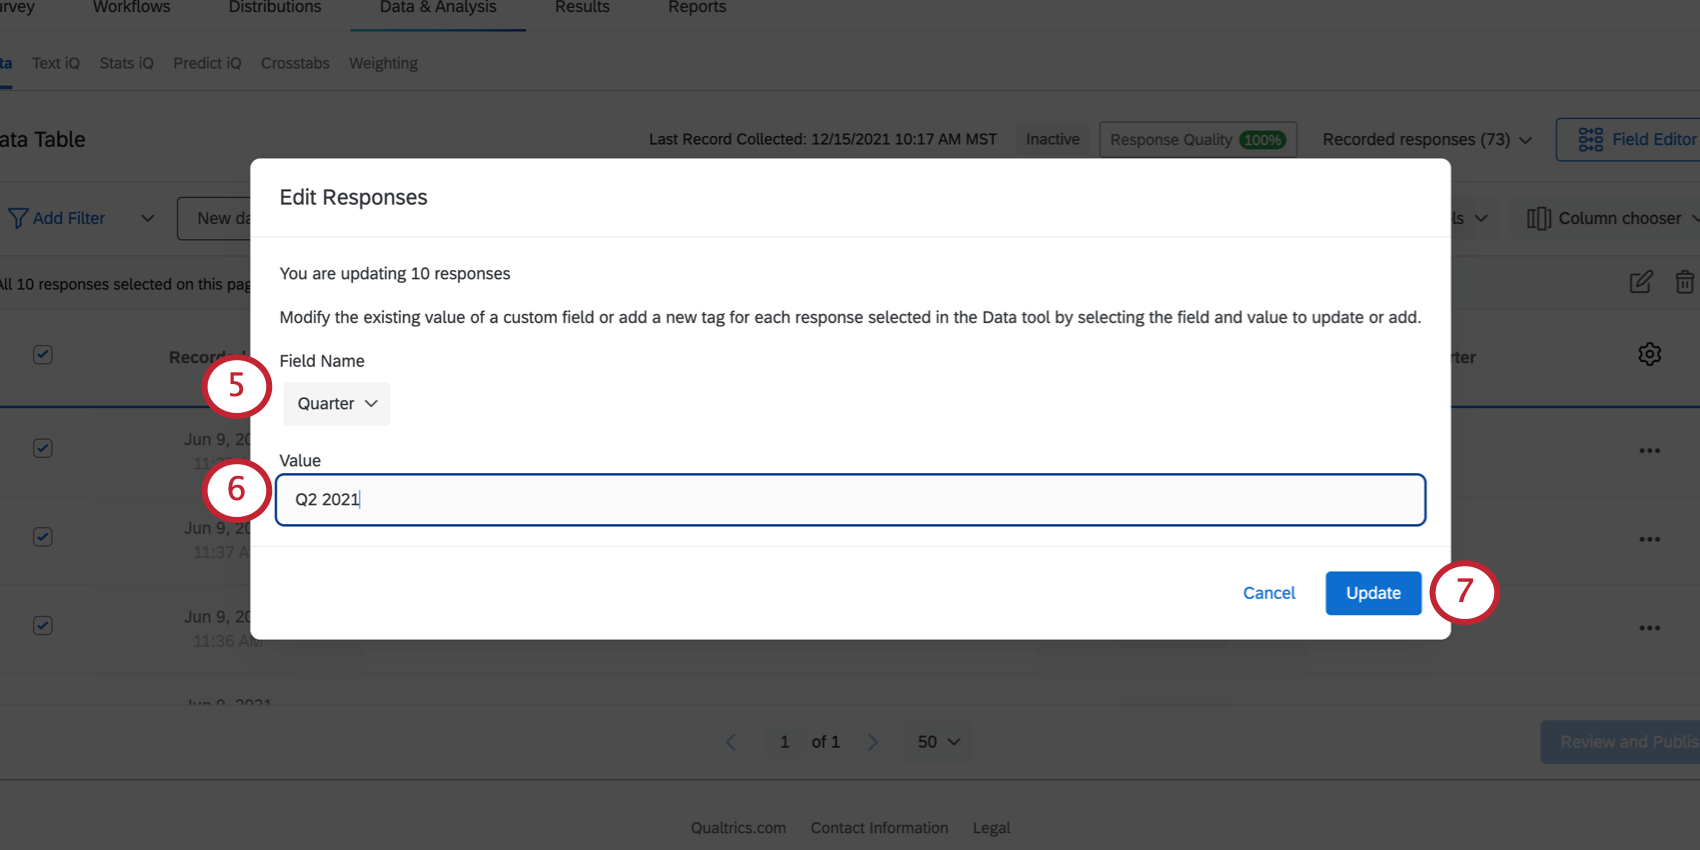
- Type in the value all these responses should have.
- Click Update.
Editing and Removing Fields
Even after you’ve created a manual field, you can make changes to it. For example, you can rename the field, mark it as sensitive, or remove it. For date fields, you can set a format.
For detailed steps, see Editing Custom Fields.
Reporting on Manual Fields
Manual fields can be used in most of the same reporting and data analysis that other response data can be used, including results dashboards and advanced-reporting. This means manual fields can be used in filters, charts, tables, and break-outs.
When you’re creating results dashboards, you aren’t limited to the widgets that work with your manual fields by default. You can adjust each field’s type to change its data format and allow you to visualize your data in different ways. For example, while bar and line charts break out text set data best, word clouds are better widgets for open text feedback.
See more about Assigning Types to Manual Fields. By default, the field types for each manual field are:
- Date – Date
- Numeric – Numeric Value
- Text – Open Text
- Tag – Text Set
For advanced-reports, you can check out each visualization’s page to learn more about which fields are compatible. See a full list of advanced-reports visualizations.
Projects Where You Can Create Manual Fields
Depending on your license, you may have access to several different types of projects that have a Data & Analysis tab. The manual fields described on this page are available in:
- Survey projects
- XM Solutions
- Imported data projects
- 360 projects
Qtip: See Creating New Fields (360) for more details.
- Conjoint
- MaxDiff
- CX Dashboards
While the functionality is technically available, we do not recommend using these custom fields with other types of Employee Experience projects. See Creating New Fields (EX) for more details.