-

Qualtrics Platform -

Customer Journey Optimizer -

XM Discover -

Qualtrics Social Connect
Global Advanced-Reports Filters
About Global Advanced-Reports Filters
Sometimes, you only want to create a report about a particular group of respondents. Maybe you’re interested in how respondents from a certain country rated your product, or maybe you only want your report to include data from the last month. You can narrow down the data presented in your reports by using filters. A global filter is a filter that applies to the whole report.
Saving and Reloading a Global Filter
Here, we go over how to add a filter (which automatically saves it) and how to use filters you’ve created in the past.
Saving a Filter
- Navigate to the Reports tab.
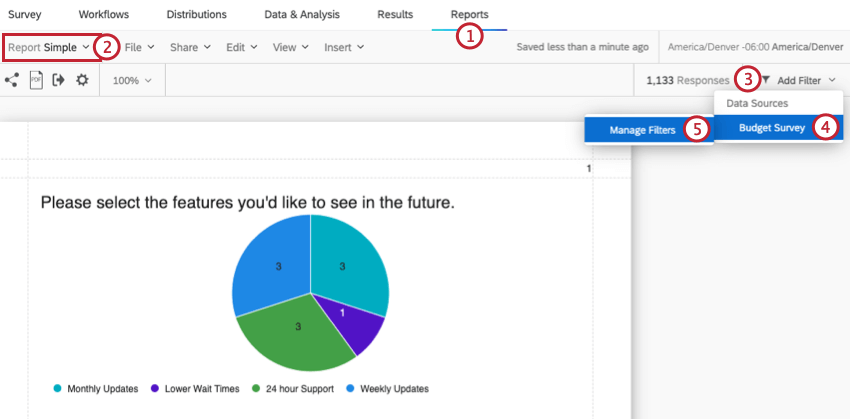
- Open the desired report.
- Click Add Filter.
- Highlight over your data source.
- Select Manage Filters.
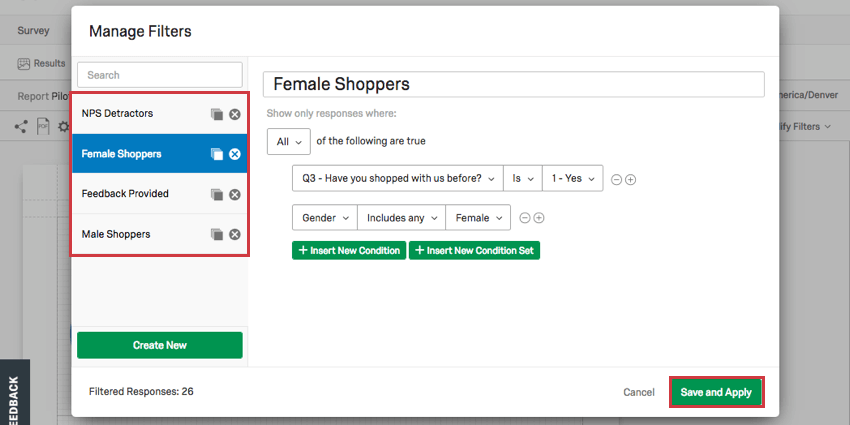
- Click Create New.
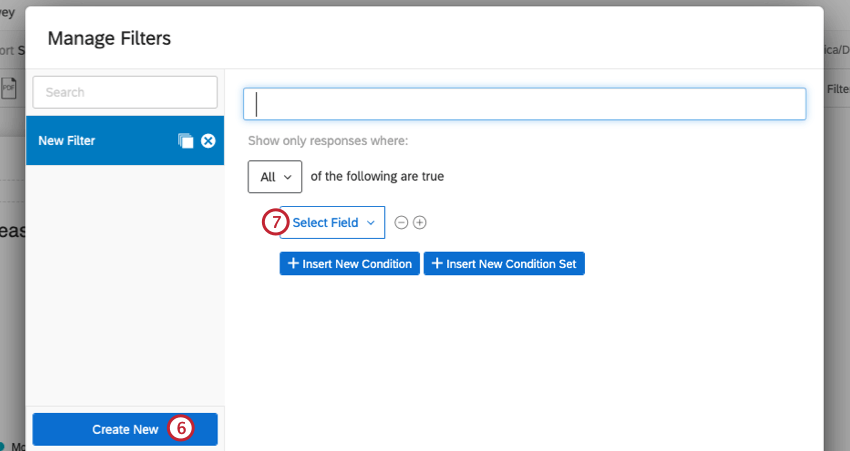
- Select the Field you want to filter by.
- Select your Operator. This is how the responses filtered out by the filter should relate to the Field’s value.
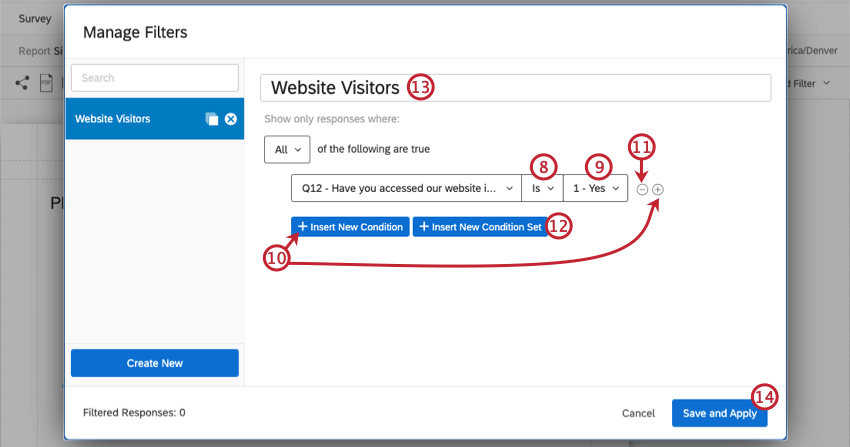
- Select the Operand. This is the value of the Field you chose.
- Click the plus sign ( + ) or Insert New Condition to add another condition.
- Click the minus sign ( – ) to remove a condition.
- Click Insert New Condition Set to nest a new condition set under the first.
- Name your filter.
- Click Save and Apply to finish.
Reloading Filters
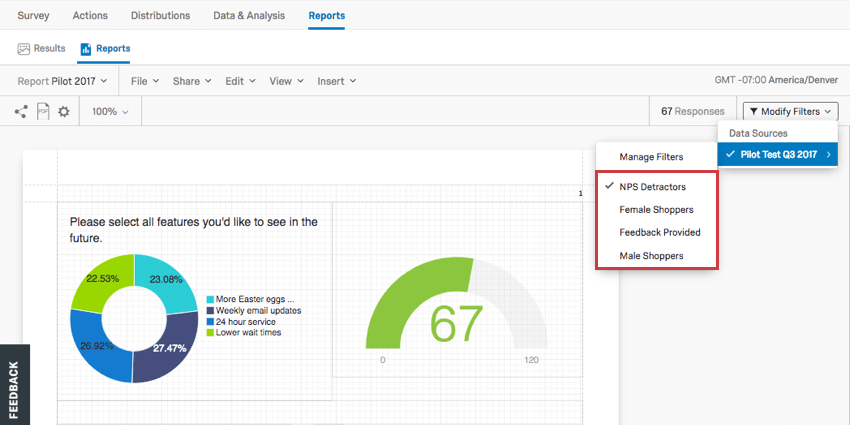
- Navigate to the Reports tab.
- Navigate to the Reports section.
- Open the desired report.
- Click Filters.
- Highlight over your data source.
- Select the filter you want to use.
Deselecting a Filter
To view your unfiltered data again, follow the steps in the Reloading a Filter section to deselect your current filter.
Conditions and Condition Sets
Filters work the same in Data & Analysis as they do in Reports – in fact, the filters you create there also appear in Advanced-Reports, and vice versa!
To learn more about building the conditions of your survey, see the following sections of the Filtering Responses support page:
Managing Filters
- Navigate to the Reports tab.
- Open the desired report.
- Click Filters.
- Highlight over your data source.
- Select Manage Filters.
- Select the filter you want to edit along the left.
- Edit the conditions or rename the filter as desired.
- Click Save and Apply.
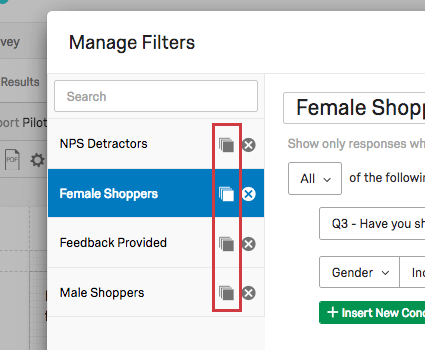
Copying a Filter
Once on the Managing Filters window, click the copy icon to the right of a filter to create an exact duplicate of it.
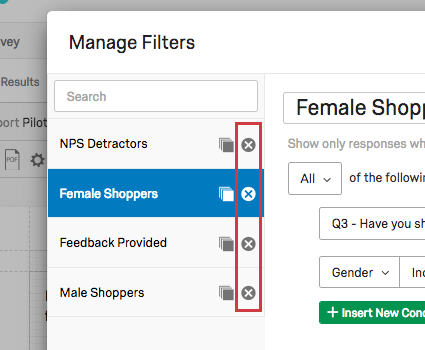
Deleting a Filter
Once on the Managing Filters window, click the X to the right of a filter to delete it permanently.
Setting Filters for Additional Data Sources
Every visualization has a Data Source. However, this source doesn’t have to be the survey you’re currently working on. It can be any survey in your account. This is useful if, for example, you want to have a table with your 2018 survey’s data next to a table with your 2017 survey’s data.
When your report contains at least one visualization with a different survey source (e.g., 2018 instead of 2019 data), you are then allowed to manage and reload filters for that survey.

To create or manage these filters:
- Navigate to the Reports tab.
- Navigate to the Reports section.
- Open the desired report.
- Click Filters.
- Highlight over your additional data source.
- Select Manage Filters to create a new filter.
- Select an existing filter to globally apply that filter to all visualizations with a matching data source that are in the subject report.