
Text Highlights (Results Dashboards)
What's on this page
Qtip: There is a new version of Results available. To opt in to the new Results Dashboards, navigate to the Results tab and click Try it now.

About Text Highlights
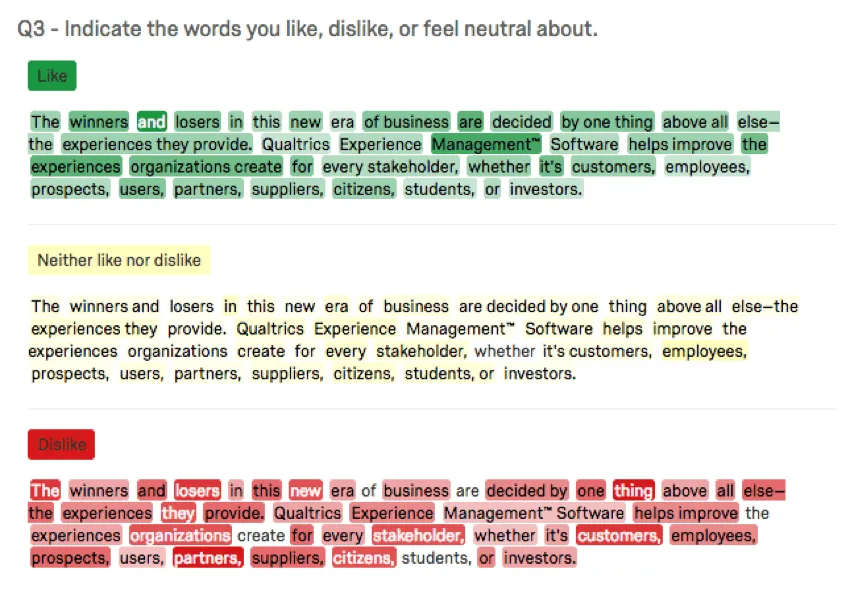
The Text Highlights visualization is a graphical representation of the data collected from the Highlight question type. It colors each word in the interactive text portion of your question with a different shade of color depending on the number of times that word was selected. Words selected more often show up darker than others.
Attention: Text highlights are only available in Results Dashboards. Text highlights do not appear in CX Dashboards or EX Dashboards.
Text Highlights in Results Dashboards
If you collected data in a highlight question, a text highlights widget will be included in your Results Dashboard by default.
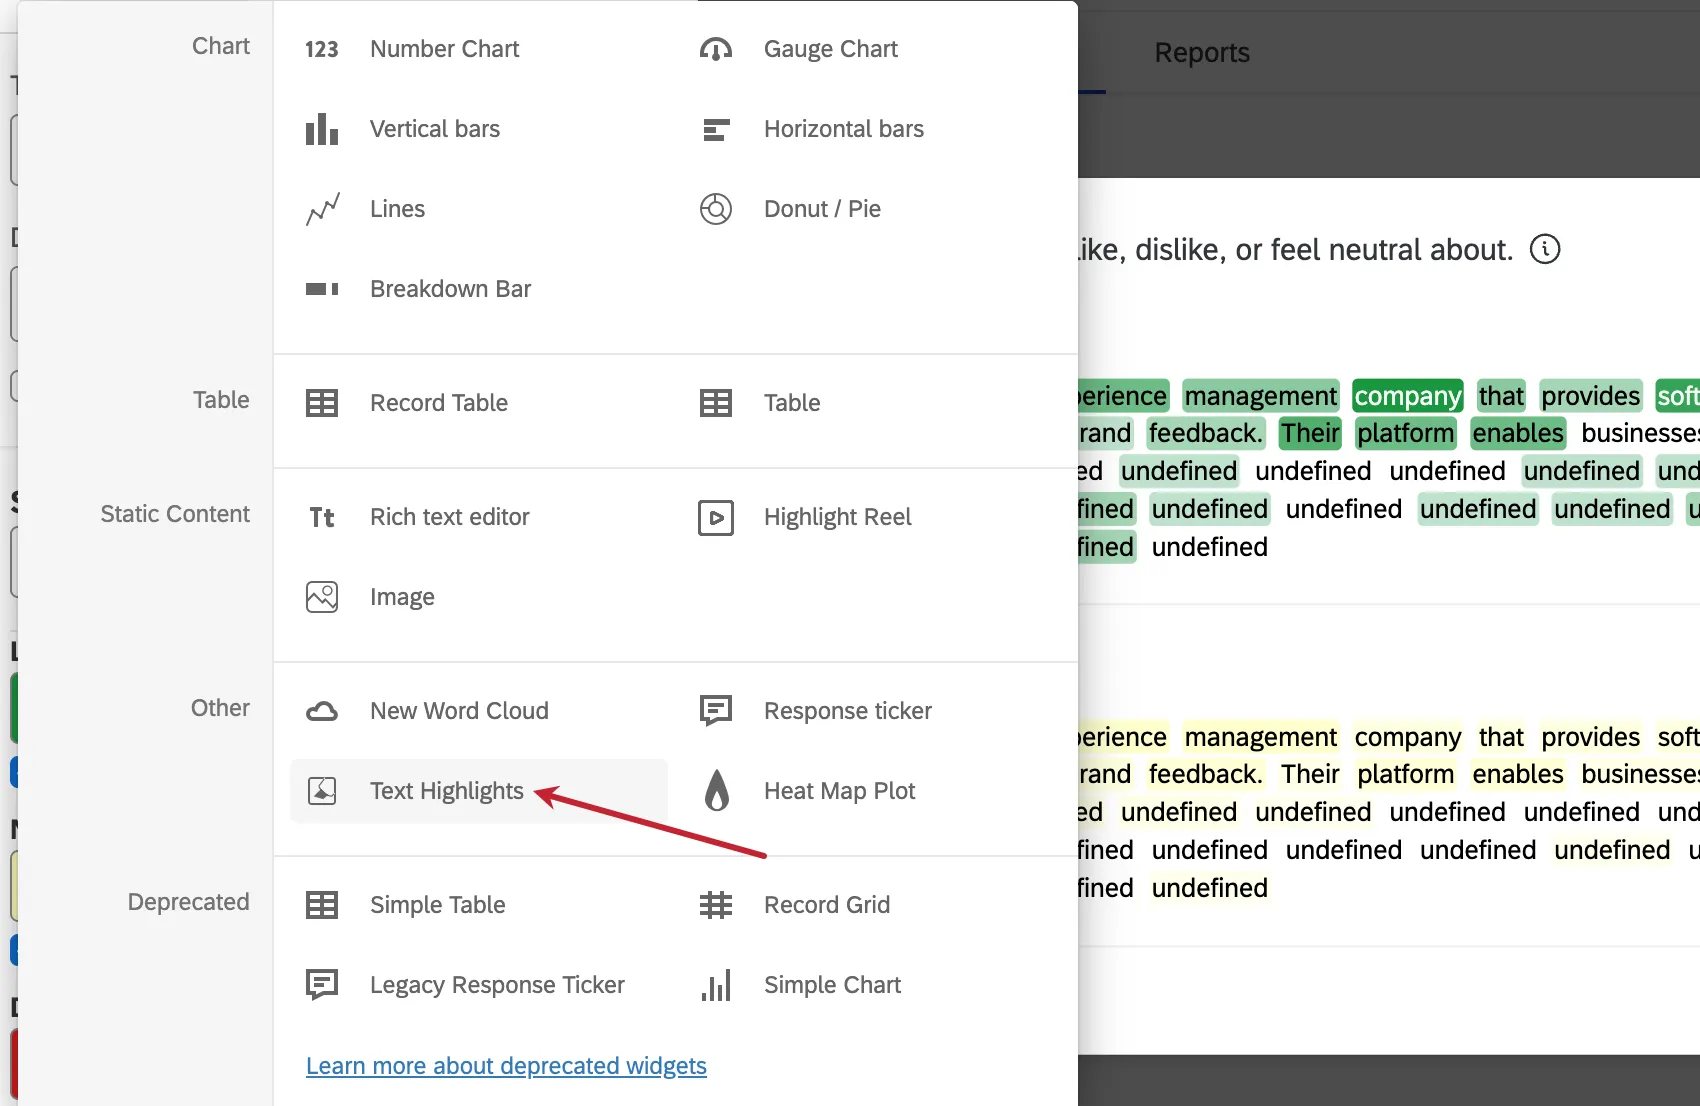
In the new widget menu, these widgets are under Other and called Text Highlights.
Basic Setup
The most important field that needs to be filled out before this widget can display data is the source. Here, you can select any individual highlight question in your survey.
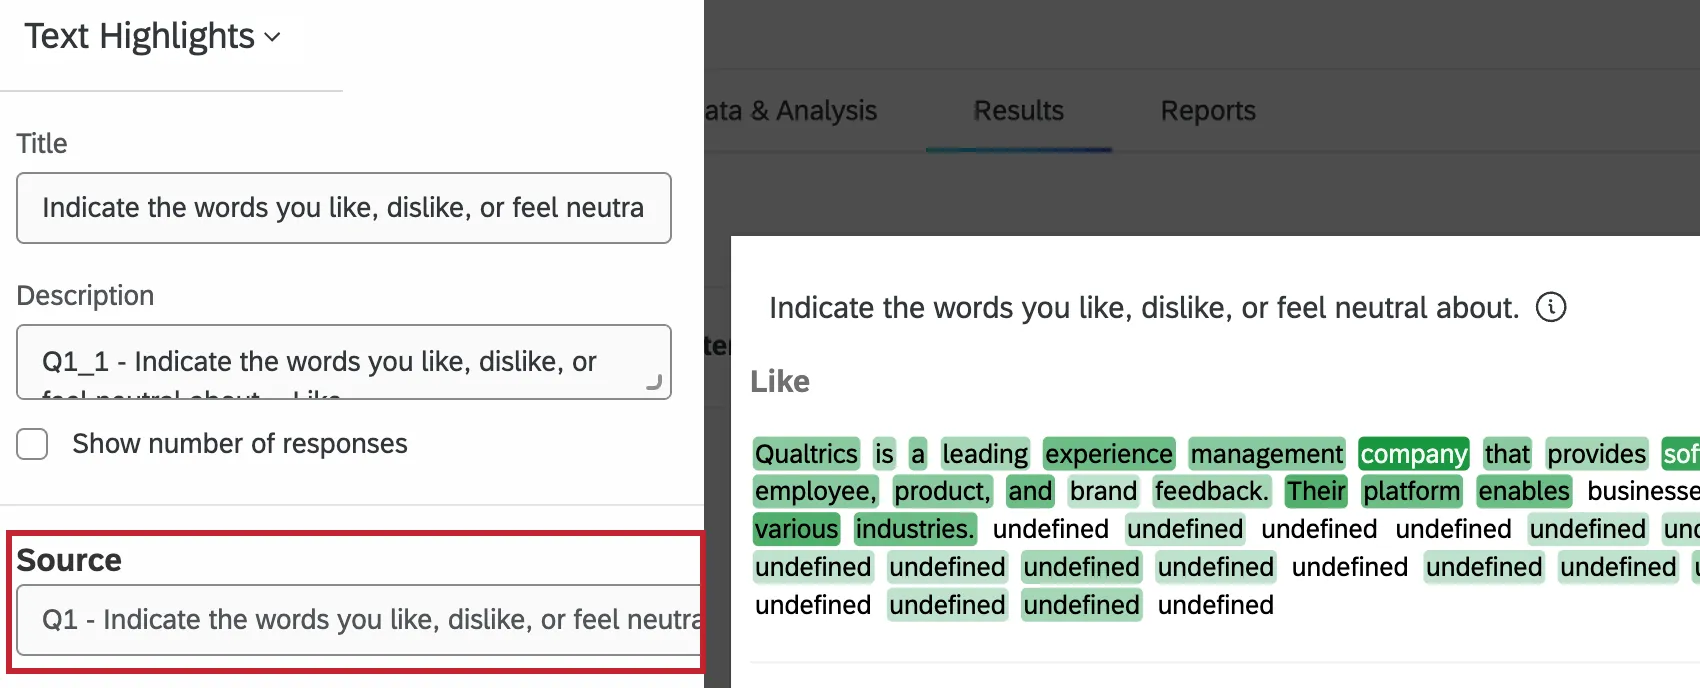
Qtip: You can only add highlight questions to the source of a text highlights widget. You cannot use any other kind of question.
Adding a title, description, or response count to your widget is optional.
Additional Options
The text highlights widget has a few additional options for customization.
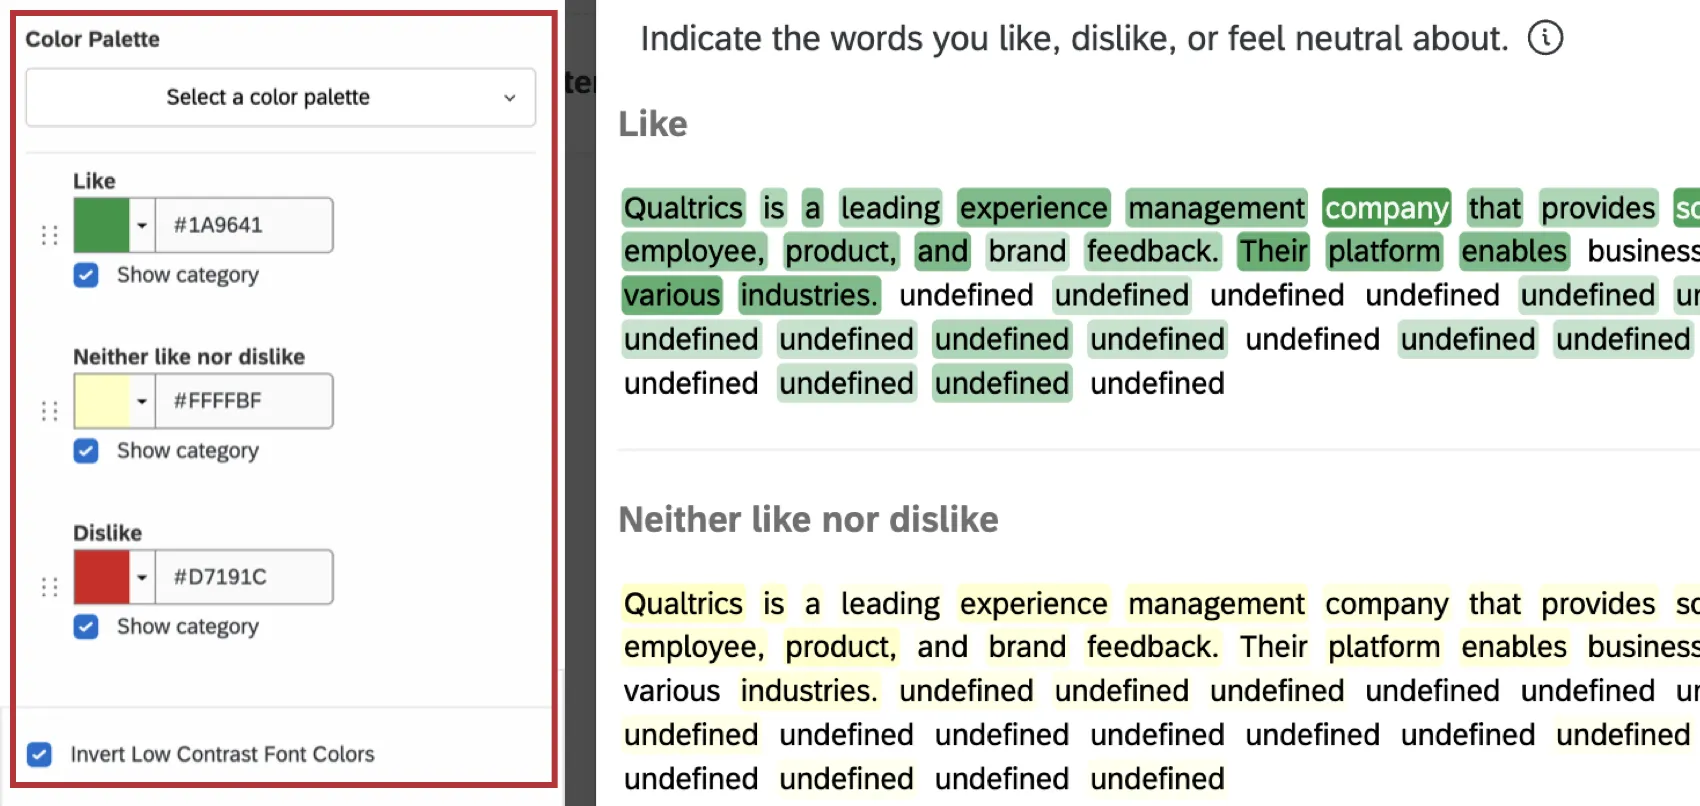
- Select a color palette: Select an existing color palette, or create a custom one. You can then select colors from this palette to use for the categories in your widget.
- Adjust colors: Select a color for each category.
- Show category: Show or hide a specific category.
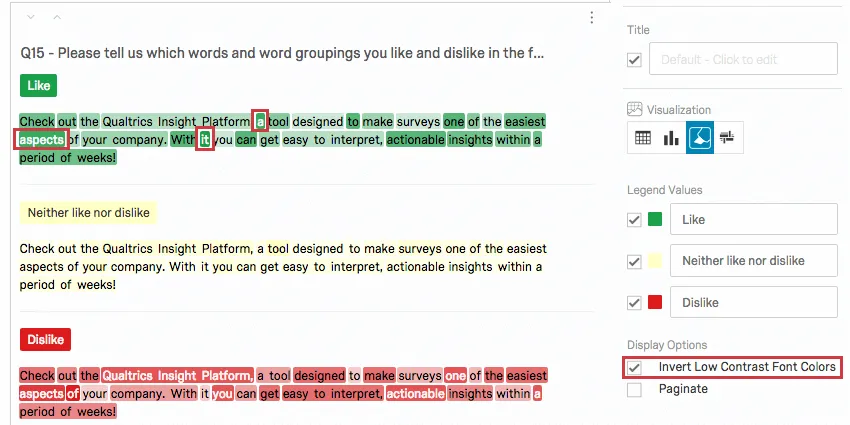
- Invert Low Contrast Font Colors: Invert colors to make it easier to read words when dark category colors are used.
For more information on the Widget Styles settings, see Editing Widgets.
Text Highlights in Legacy Results
This section covers how text highlights work in the legacy Results. We highly recommend using Results Dashboards instead; see Migrating to Results Dashboards for support.
Legend Values
You have a variety of options concerning the answer names (or “legend values”), including the following:
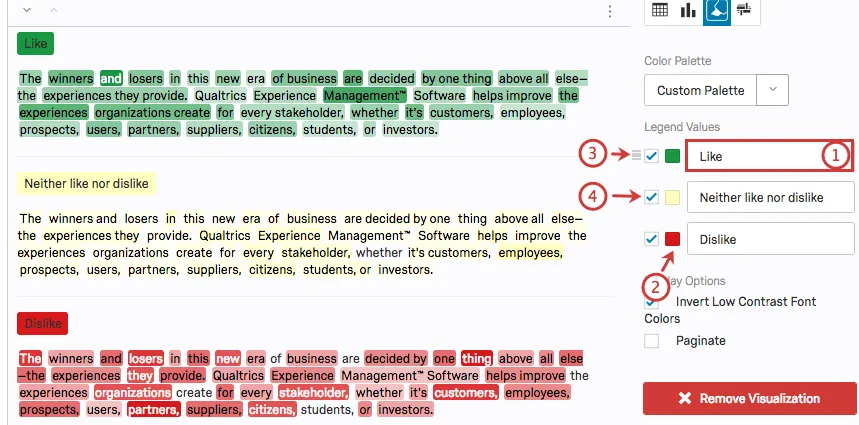
Display Options
You have two settings under the Display Options list in the editing pane. Some of these options will be enabled by default, but you can enable any combination of these to achieve your desired visualization:
Invert Low Contrast Font Colors: When selected, this setting changes the color of the text from black to white for words that are selected often in order to make the text easier to see.
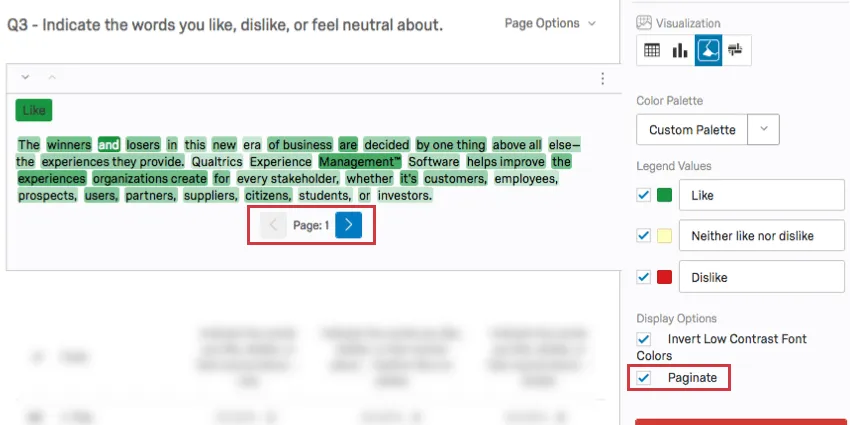
Paginate: Break up your visualization into one page per category rather than display categories together as one long page.
That's great! Thank you for your feedback!
Thank you for your feedback!