
Using Multiple Datasets in a Dashboard (CX)
What's on this page
Qtip: This feature is not available to all customers. If you’re interested, reach out to your Technical Success Manager to see if the “composable dashboards” feature is right for your program.
About Using Multiple Datasets in a Dashboard
As your experience research programs grow and become more complex, you may already have individual datasets you’ve made that would take time to rebuild into one big dataset. You may also just want to visualize different datasets in one dashboard. You can resolve both of these goals by adding multiple datasets to a single dashboard.
Qtip: A data source is a place data comes from, such as a survey, imported data project, or a directory. A dataset is the collection of one or more data sources for use in a dashboard.
By adding multiple datasets, you can have widgets from different datasets presented side by side, or even show multiple datasets’ results in the same widget. You can even use linked filters that will work regardless of the dataset, creating a seamless experience for your dashboard viewers.
Example: Linking fields between multiple datasets makes it faster and easier to compare historical data or data collected across multiple locations. Rather than join and merge these datasets, you can focus on linking the field you want to be able to filter all of your data with, such as date or department.
Qtip: Every dashboard has a default dataset. This is the original, primary dataset of the dashboard. This is also the default selected dataset when you set up individual widgets.
Example of Multiple Datasets in a Dashboard
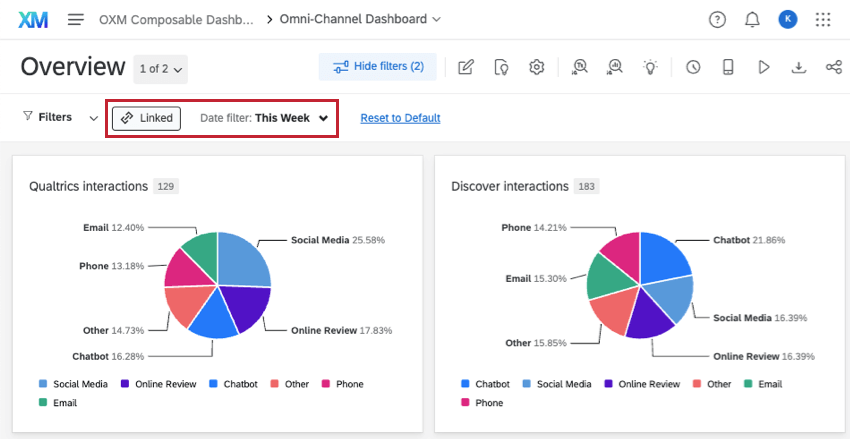
Let’s say you want to show all the distribution channels where you’ve collected data, such as chats, emails, phonecalls, and so on. You want to show a breakdown of responses across channels and allow viewers to filter interactions by date, regardless of where the data came from. But you have distribution channels in two fairly different datasets: one imported from Discover, and the other from Qualtrics.
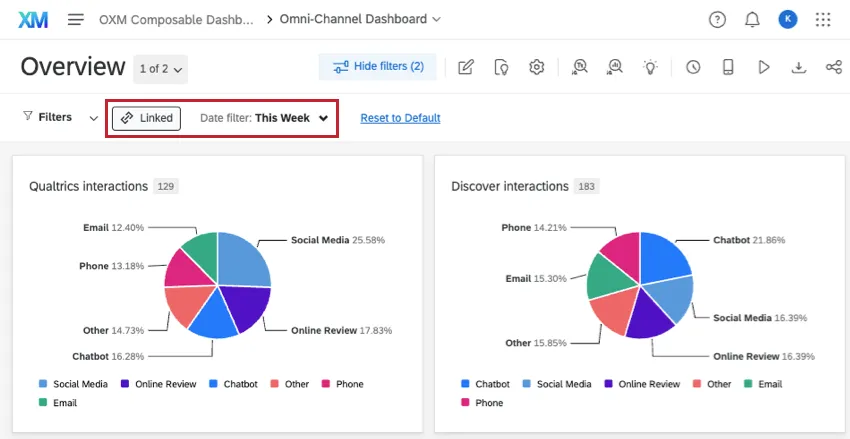
As the date filter is adjusted, both widgets are affected. This allows dashboard viewers to see a wide range of data from different sources without you, as the dashboard builder, having to create complex joins or build a new, combined dataset.
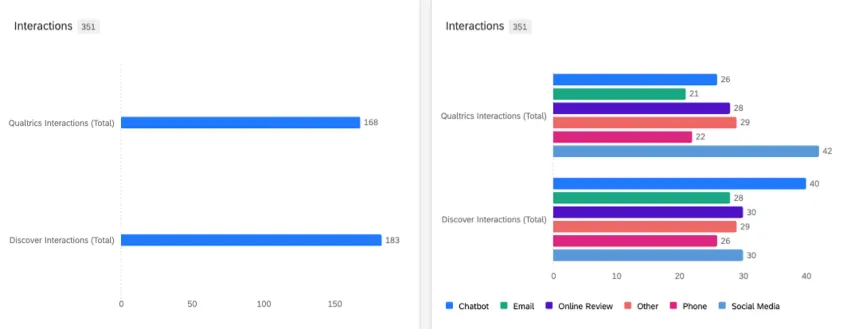
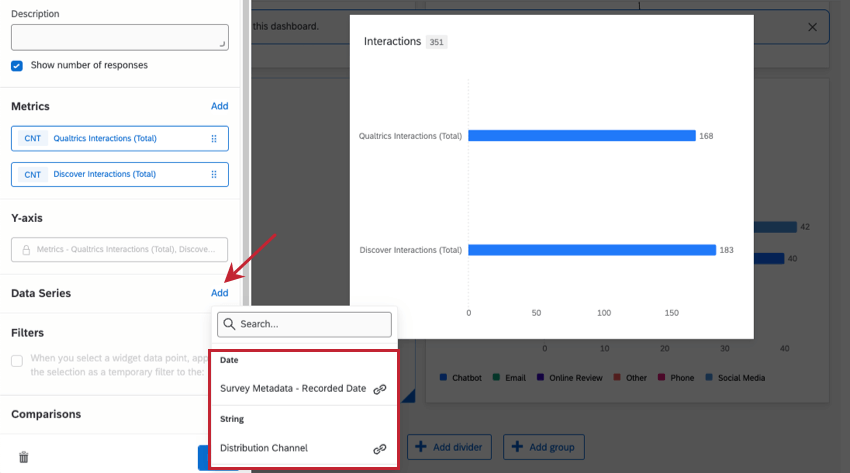
Instead of creating two separate widgets, you can also create a single table, line, or bar widget that shows data from multiple datasets.
Example: Both of the bar widgets below show data from both our Qualtrics and Discover datasets. The left widget shows a simple response count for each dataset. The right widget shows response count for each dataset broken out by distribution channel, which is a linked field.
Types of Dashboards that Support Multiple Datasets
Multiple datasets are only available in Dashboard projects (CX Dashboards).
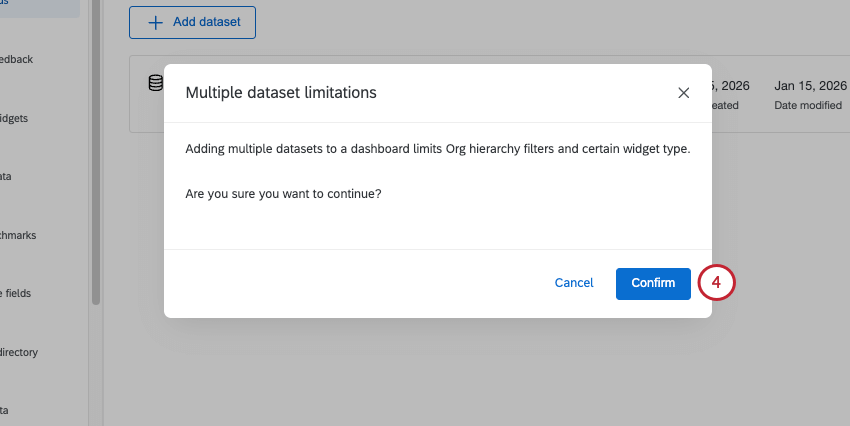
Qtip: Org hierarchy filters and certain widgets are not compatible with multiple datasets.
Multiple datasets are not available in Survey Results Dashboards, BX Dashboards, or in any Employee Experience dashboards.
Attention: Qualtrics Assist (CX) is not supported in multi dataset dashboards.
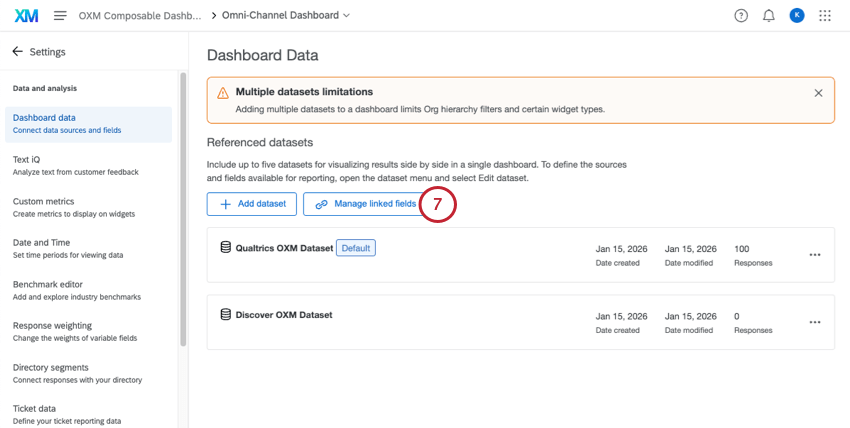
Linking Fields Between Datasets
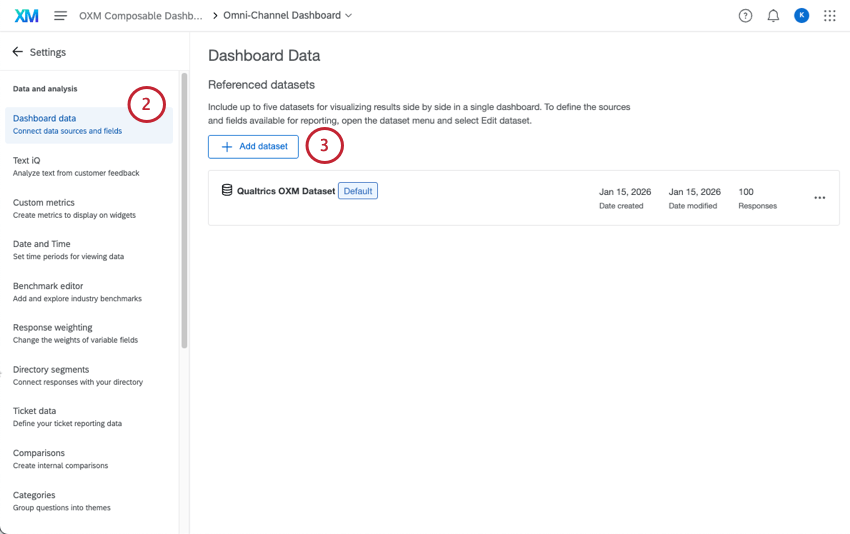
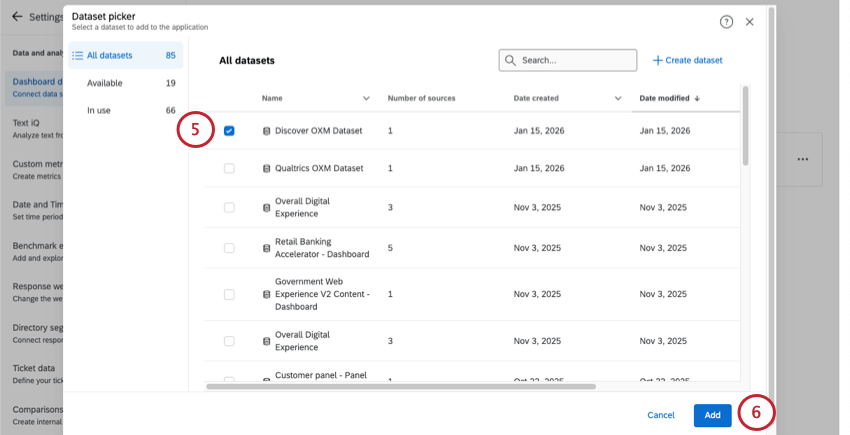
Before you can use multiple datasets to build reports for your stakeholders, you need to add another dataset to your dashboard, and link fields that should be the same across datasets.
There is no limit to the number of linked fields.
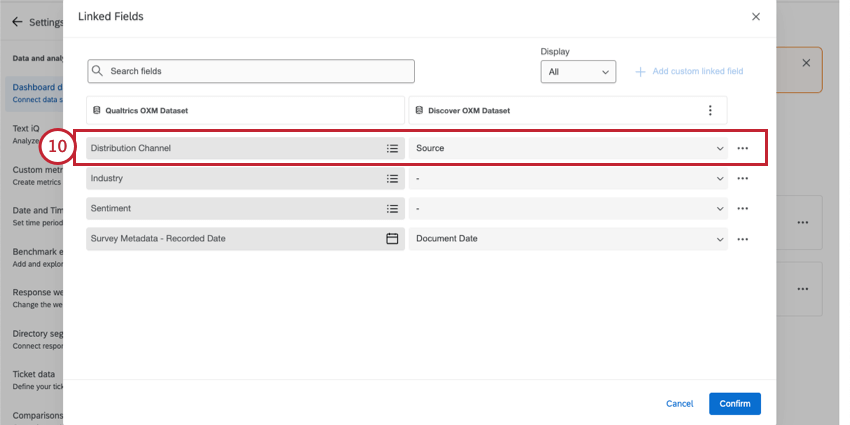
Qtip: The fields you want to link must be the same field type in each dataset.
Qtip: Different versions of the same field in different datasets don’t have to have the exact same values. However, we recommend using similar recoding to ensure concepts are linked where applicable. For example, “phonecalls” and “Phone” might not be identified as the same distribution channel, but they would if they were both named “Phone.”
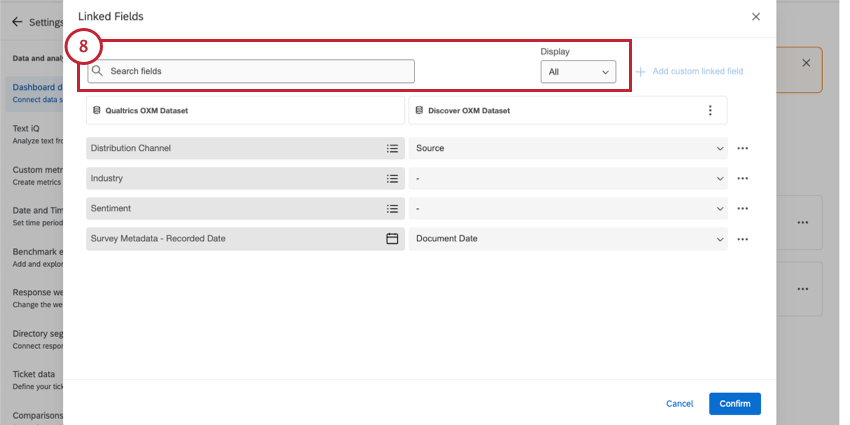
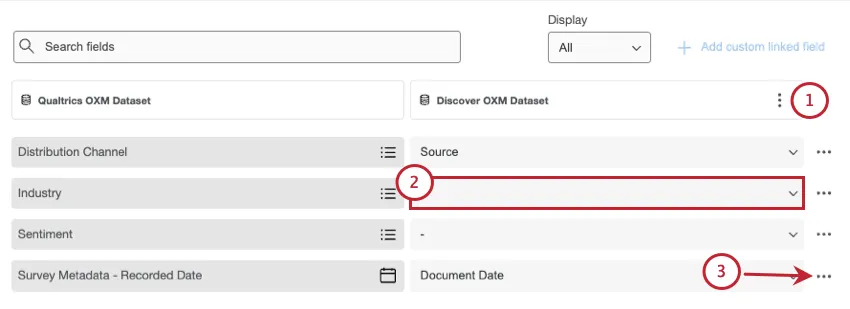
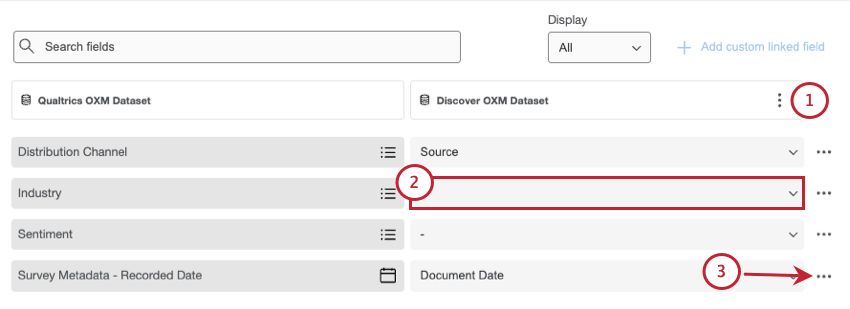
Qtip: The Display filter lets you narrow down results to all fields, just unlinked fields, or just linked fields.
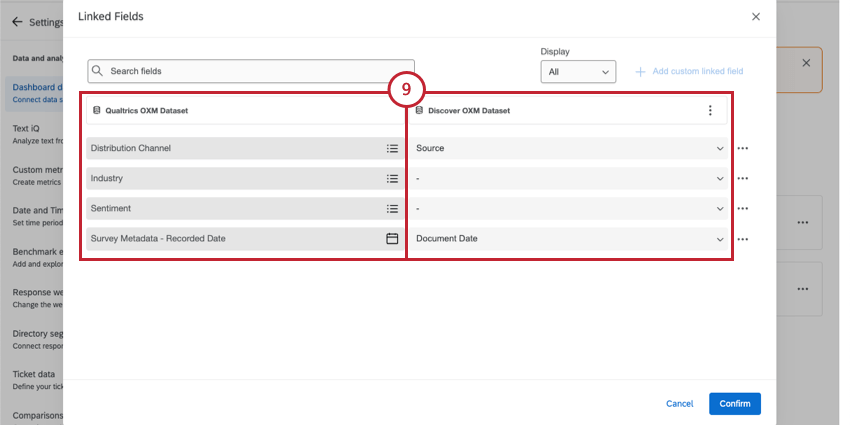
Example: The default dataset has a field called “Survey Metadata – Recorded Date.” We mapped this to the “Document Date” field in our second dataset.
Auto-link fields
We provide a tool that makes it easy to link fields that have similar names. By using auto-link, you can even link multiple sets of fields at a time.
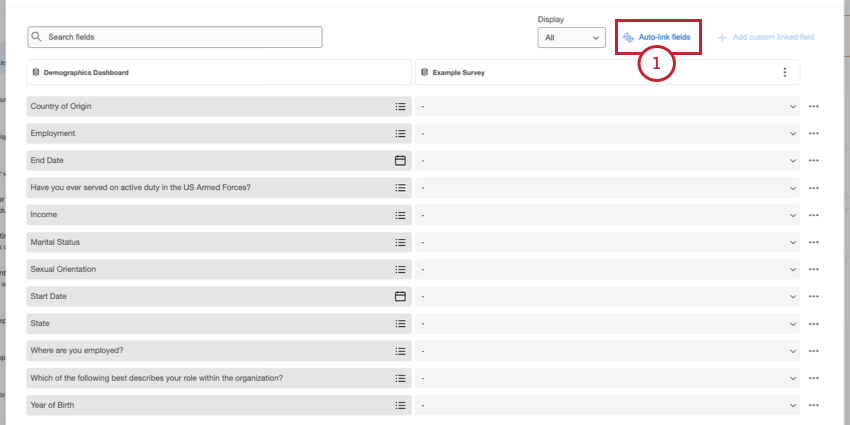
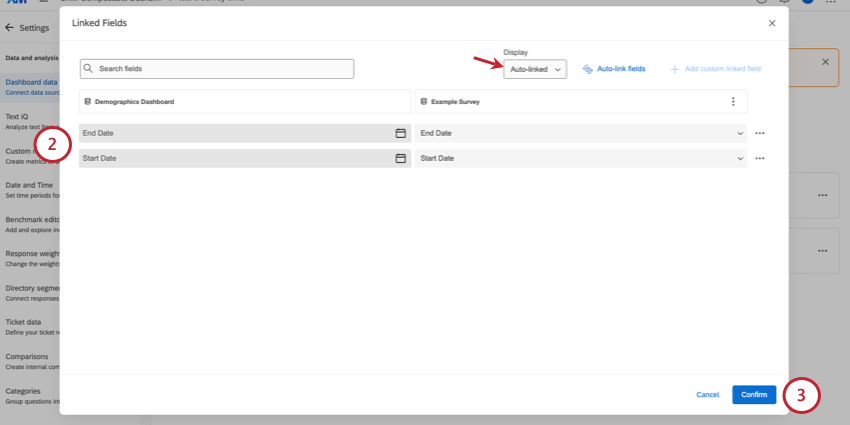
Qtip: Only auto-linked sets of fields will be displayed.
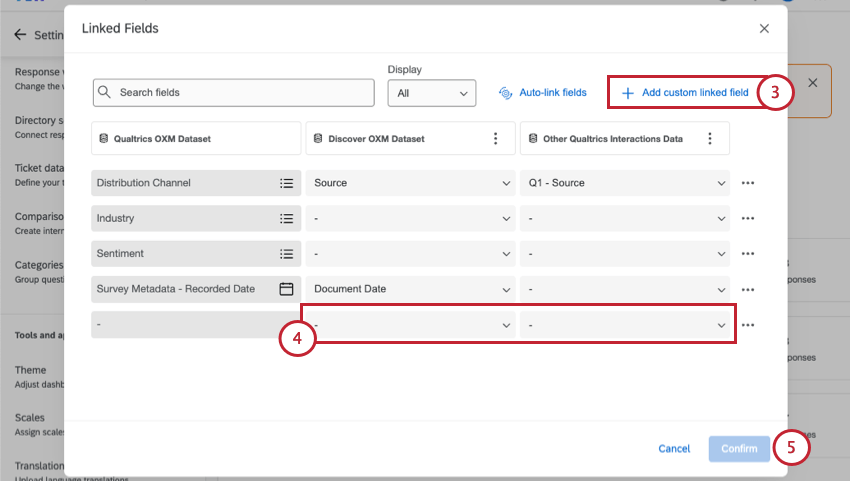
Custom Linked Fields
Custom linked fields are useful if you have 3 or more datasets in your dashboard. The purpose of a custom linked field is to let you link fields from datasets without including anything from the default dataset (i.e., the primary dataset).
Example: You have 2024, 2025, and 2026 datasets mapped. In 2025, you introduced a new question asking respondents how many children they have. 2024 is your default dataset, and has no “number of children” field. But you’d still like to be able to link this across 2025 and 2026, so you create a custom linked field.
Qtip: Click Add dataset to add more datasets to the dashboard.
Qtip: If you need to add a new field to your default dataset, custom linked fields are not the way to do this. Instead, select your default dataset from your dashboard’s referenced datasets.
Then, add a new field. (Instructions for a data model.)
Clearing Linked Fields
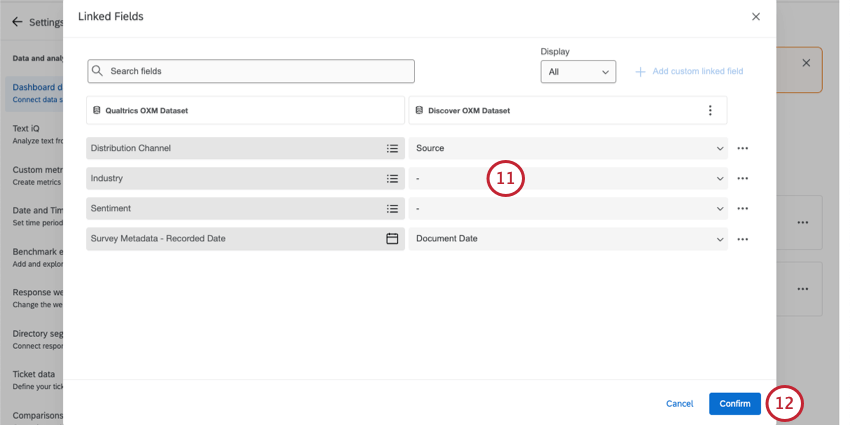
You can easily disconnect linked fields in a few different ways:
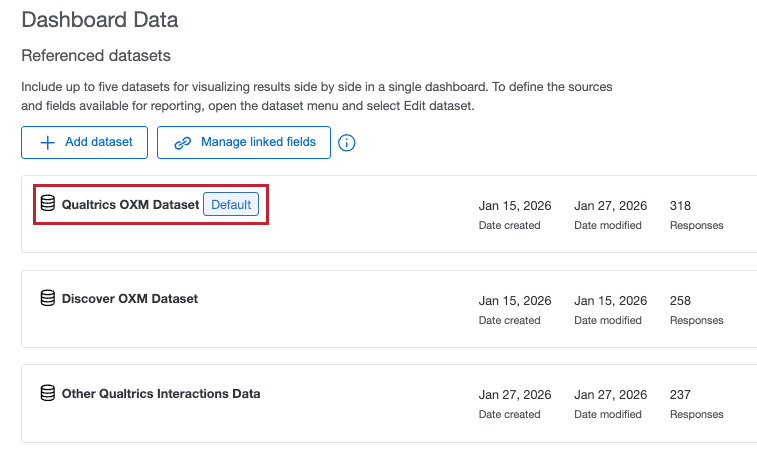
Managing Datasets in a Dashboard
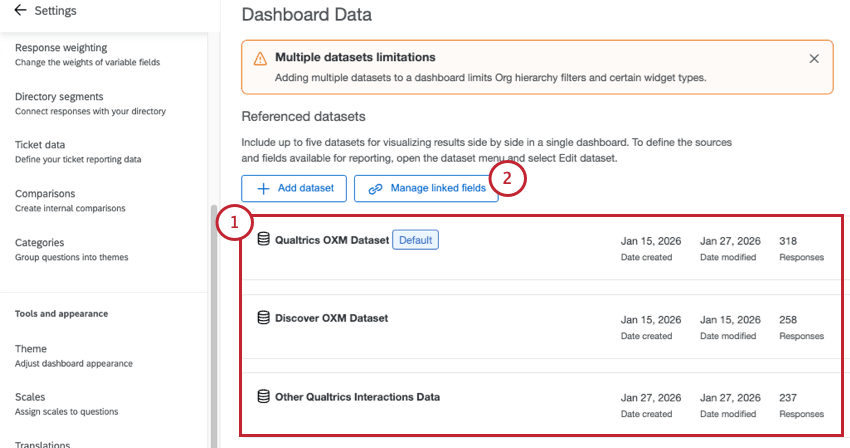
Qtip: You can have a total of 6 datasets in a single dashboard.
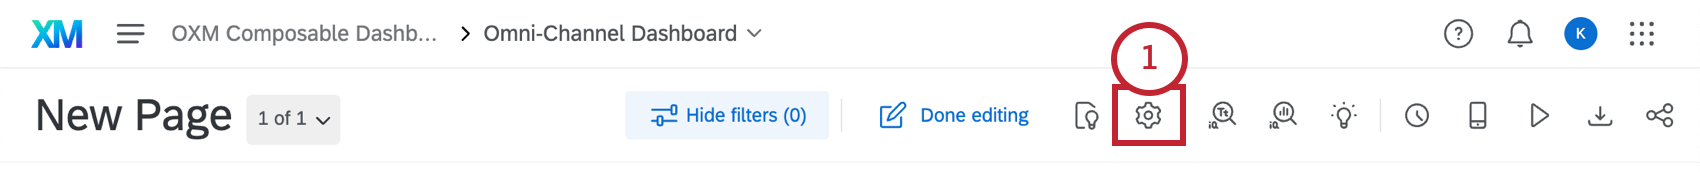
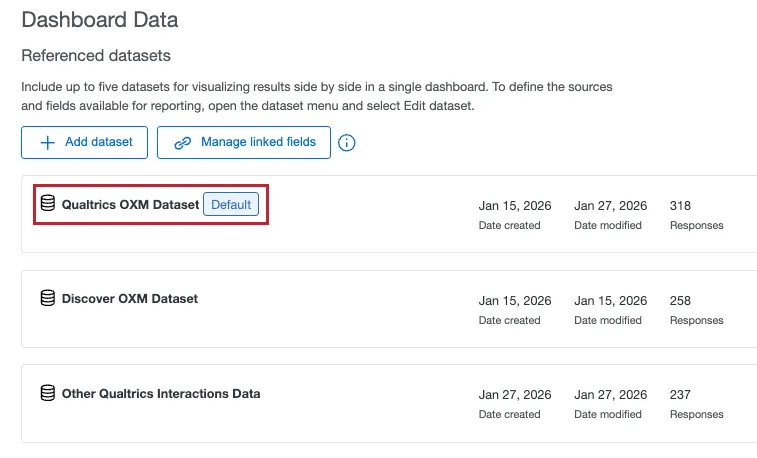
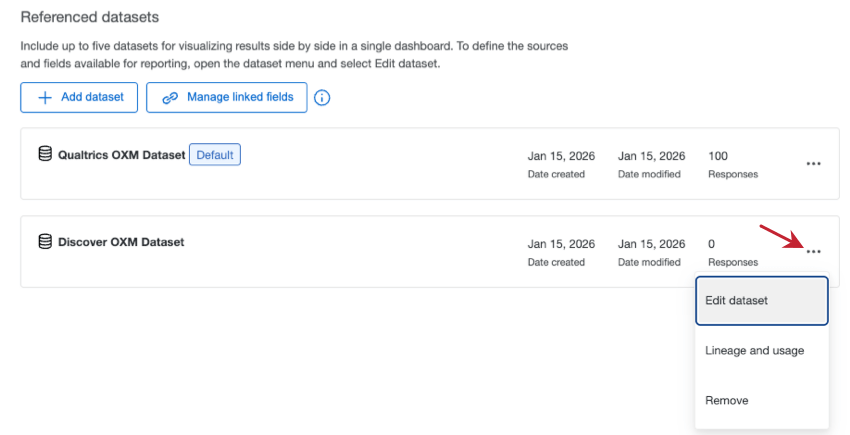
In Dashboard data, you can manage all of the datasets you’ve added to your dashboard. Click the 3 dots to see more options:
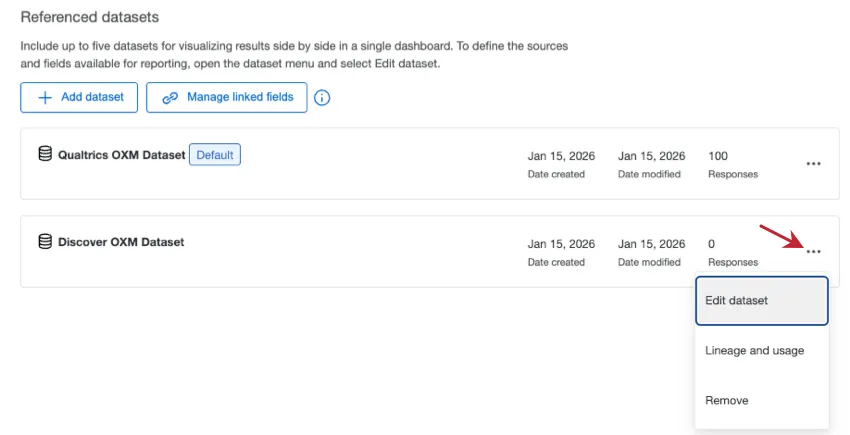
- Edit dataset: Edit the individual dataset. This is where you go to edit fields, add new fields, change recodes, and more. For more details, see data mapper and data model
- Lineage and usage: This option opens the Data page in a new tab and shows you all the places where the dataset is being used. See more on Lineage and Usage.
- Remove: Remove the dataset from the dashboard. Qtip: You cannot remove the default dataset from the dashboard.
 Warning: Make sure you consider linked fields, filters, and widgets before you delete a dataset from your dashboard!
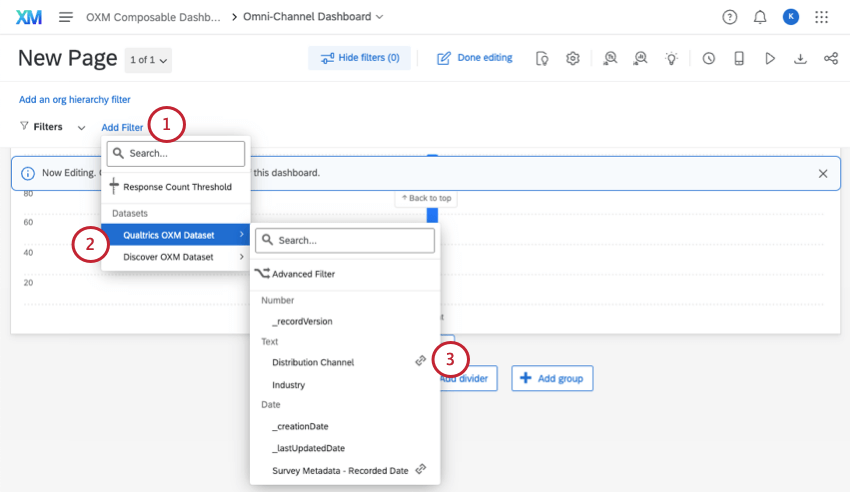
Creating Linked Filters
Once you’ve linked a field across datasets, the next step is to create a linked filter. Let’s say you want to display data from multiple datasets in your dashboard. A filter that only references one dataset can only affect widgets from the same dataset. But a linked filter could narrow down data in all of the widgets, no matter the dataset.
Qtip: Response count thresholds do not need to be linked and will work on all widgets regardless of dataset.
Qtip: Advanced filters cannot be used to create linked filters. Advanced filters can only reference one dataset at a time, regardless of whether they include linked fields.
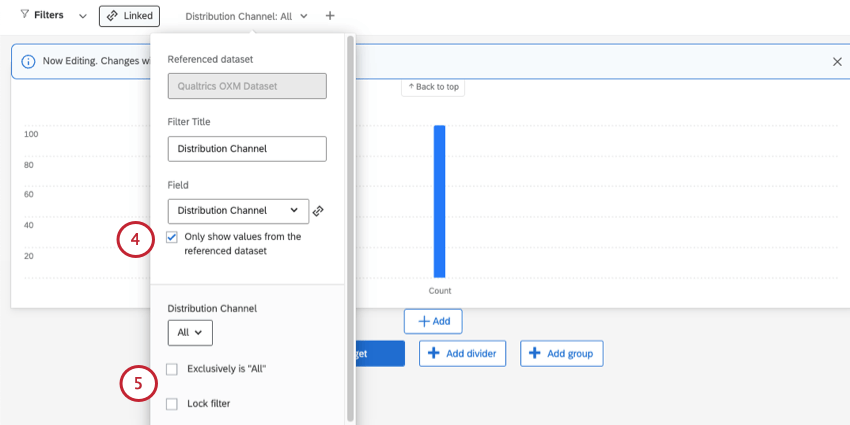
- Selected: Only let dashboard viewers use the options available in the dataset you chose in step 2. Example: Your selected dataset has the Distribution Channels of Chat, Email, Phone, and Reviews. Regardless of the Distribution Channels available in your second dataset, you’ll only see these 4 options listed.

- Deselected: Dashboard viewers can use the options available in either dataset. Qtip: The option Only show values from the referenced dataset only appears when filtering a linked field by certain field types. When not selected, all values from both datasets’ fields will appear in the filter value selection.Qtip: This option exists because the values can vary for a linked field across datasets. The more you align recode values between the separate datasets, the more seamless the filter experience will be.
Using Linked Filters
Filters in the dashboard will be separated based on the datasets they can impact. Linked filters can impact multiple datasets.
Linked filters behave a lot like regular, unlinked filters. For example, if you filter by a value, and your linked widget doesn’t have data for that value, it won’t show data.
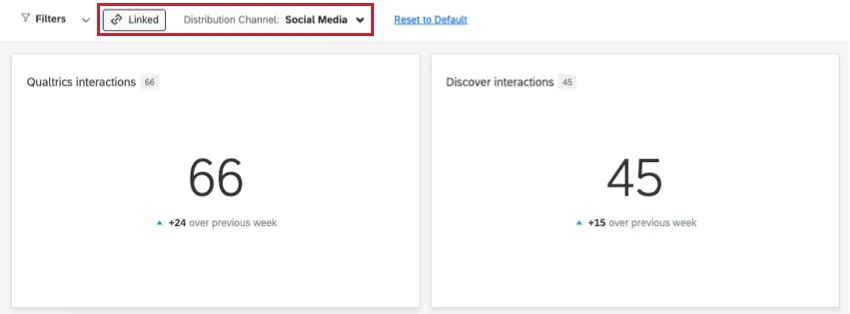
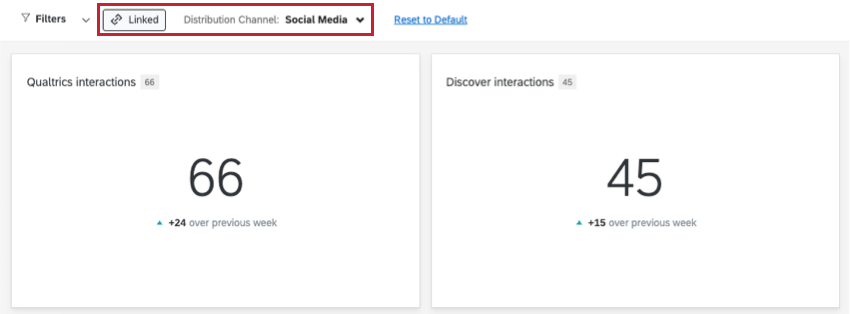
Example: You have 2 datasets in your dashboard. You decide to show response count from each dataset side by side in 2 separate widgets. You’re filtering by the linked field, Distribution Channel. When you filter by the distribution channel “Social media,” both of your datasets’ widgets show the data that meets this criteria.
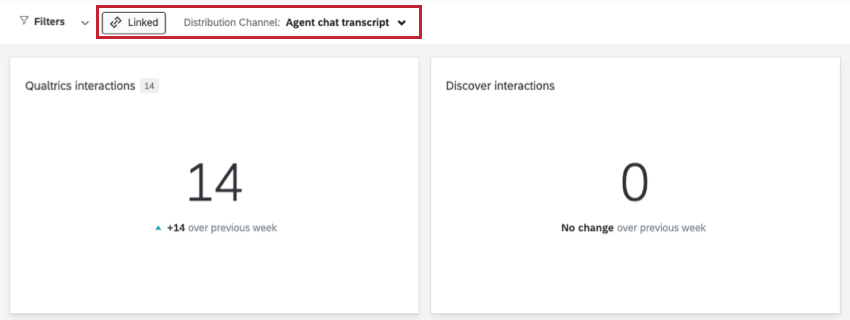
However, let’s say Dataset 1 includes an “Agent chat transcript” channel, but Dataset 2 doesn’t. It could be that this data hasn’t been collected for the second dataset yet, but it could also be that this value is only available in the first dataset. Regardless, when you filter for this distribution channel, the Dataset 1 widget shows relevant responses, whereas the Dataset 2 widget shows that 0 responses fit this criteria.

Only widgets that reference the datasets in the linked field will be affected by the relevant linked-field filter.
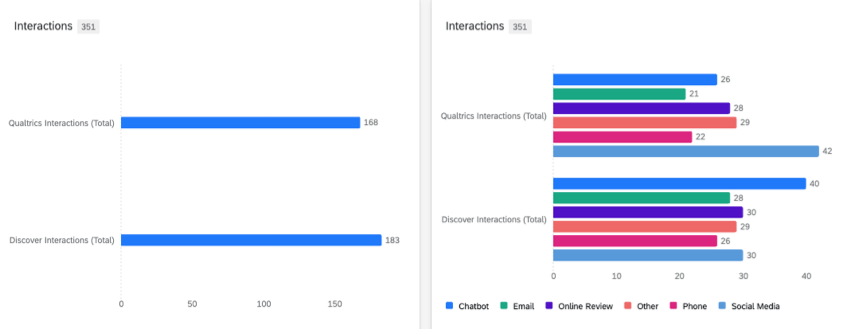
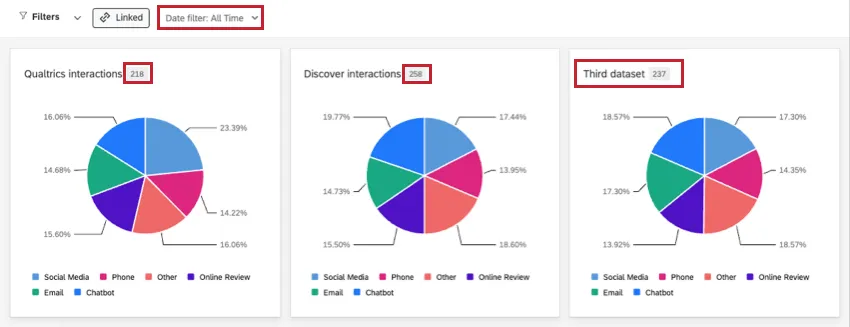
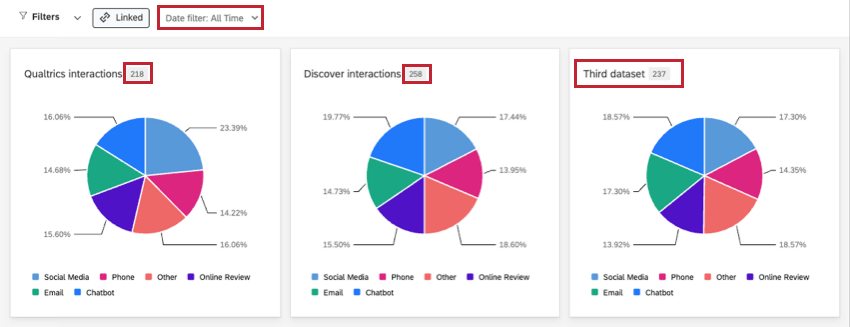
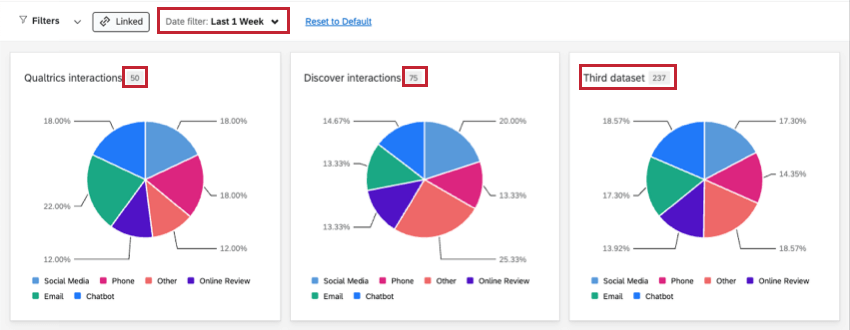
Example: You have 3 datasets. In your third dataset, you don’t link the date field. When you filter by date, the third dataset’s widgets do not change. (In the screenshots below, we show how widgets react to a changing date filter, with the third widget unaffected.)

Saving Linked Filters
You can save filters so you can go back to your favorite configurations later. When you have multiple datasets in your dashboard and / or linked filters, this can cause saving filters to behave a little differently.
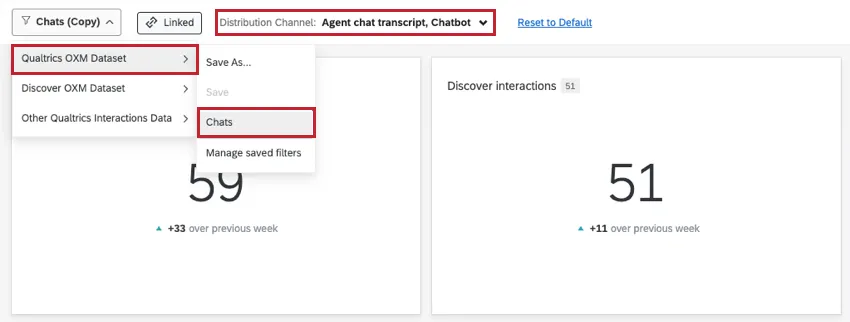
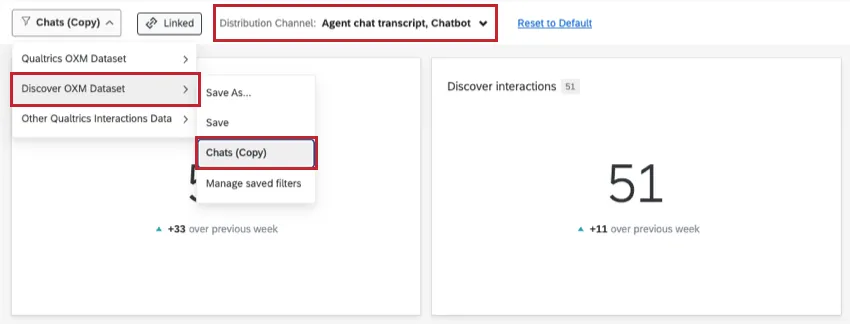
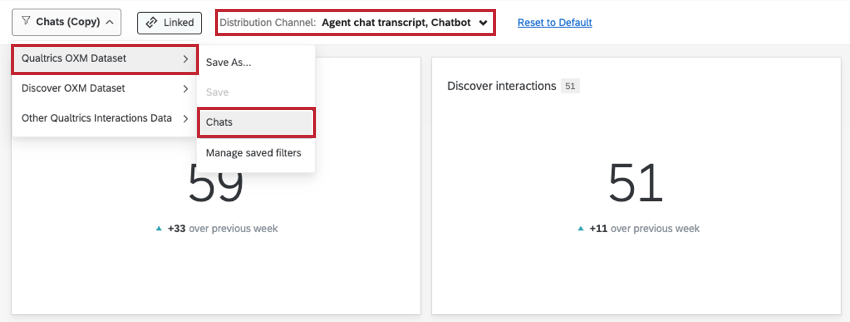
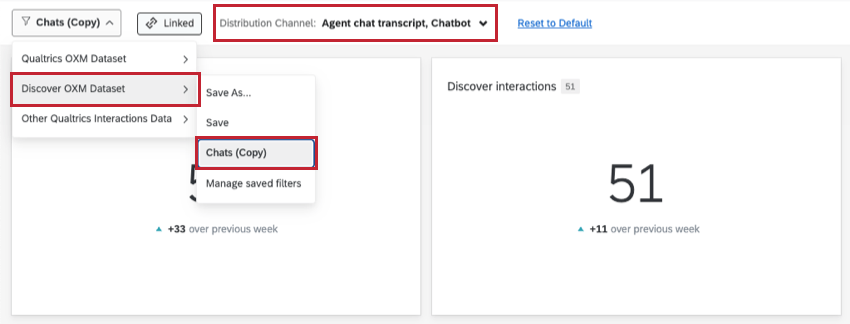
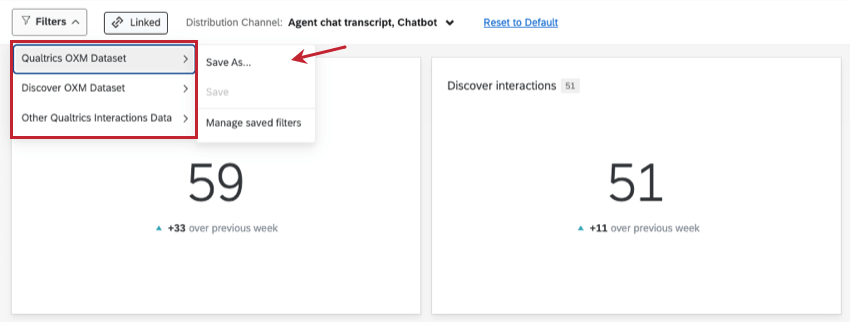
When you open the filter menu, you’ll see that there’s a section for each dataset. Thus, filters are saved, selected, and managed separately by dataset, even if they have linked fields. This also means you can save a linked filter under each dataset it belongs to, thus saving it multiple times.
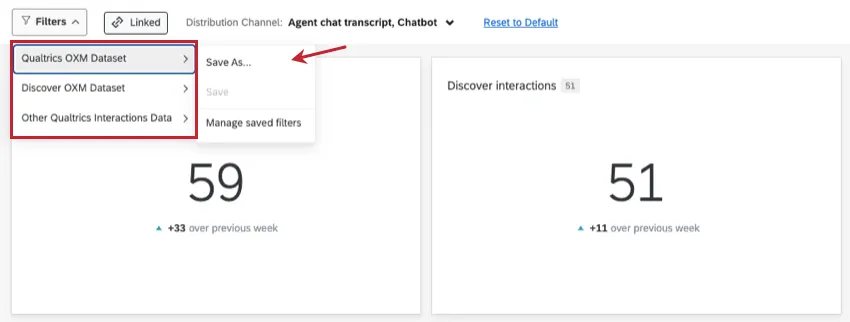
Example: For example, here our “Distribution Channel” field is linked between our Qualtrics and Discover OXM datasets, so we’ll save the filter 2 times, once under each dataset. Later, to reapply this filter, I could use the version saved under either dataset.
It’s important to keep in mind that when you save a filter multiple times under separate datasets, these are treated as separate filters. That means new changes can only be saved to whichever filter you currently have selected.
Adjusting multiple dataset filters and saving
You can have filters from linked fields and different datasets add to the same page at the same time.

When you adjust your filters and save those configurations for later, it doesn’t matter what datasets your fields come from. When you save the filter, it saves all of the configurations.
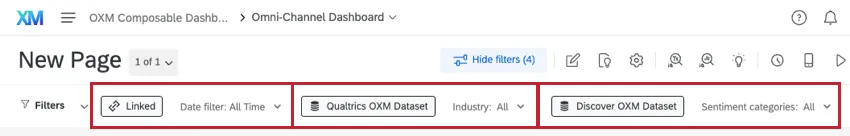
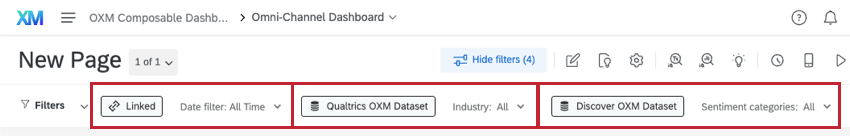
Example: Look at the filter below. It narrows down results that match any of the following criteria:

- Linked field “Date” is from “This Quarter.”
- Qualtrics OXM Dataset “Industry” includes “airlines.”
- Discover OXM Dataset “Sentiment categories” matches any of the 4 sentiments selected.
You save this filter under the “Qualtrics dataset.” However, when you apply this filter, it applies all three fields’ filter selections, including the Discover-only selections for “Sentiment categories.”

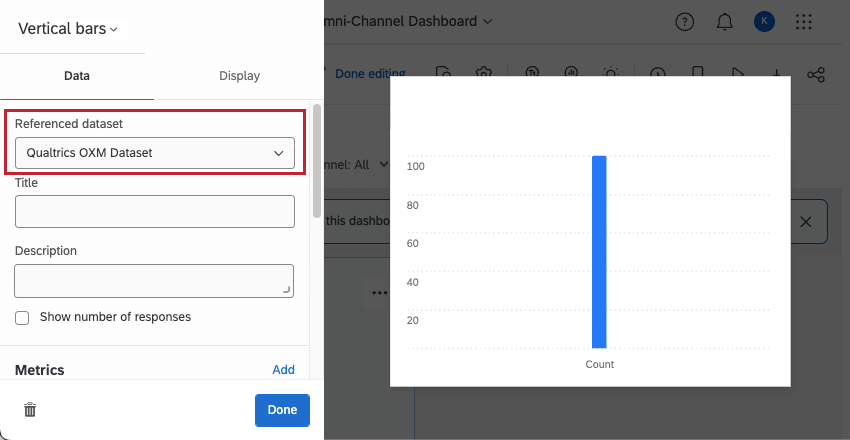
Adjusting a Widget’s Referenced Dataset
Once you’ve added multiple datasets to your dashboard, you can choose which dataset is referenced in each widget you create. This can be thought of as the widget’s primary, or default, dataset.
When you edit a widget, you can adjust the Referenced dataset being used.

Widgets that let you reference different datasets:
- Breakdown bar
- Line chart
- Horizontal bar chart
- Vertical bar chart
- Donut / pie
- Gauge chart
- Star rating
- Scatterplot
- Table
- Record table
- Digital Opportunities
- Response ticker
Widgets that only reference the default dataset:
- Breakdown trends
- Text iQ bubble chart
- Journey chart
- Multiple source table
- Breakdown table
- Text iQ table
- Key drivers
- Focus areas
- Coaching priorities
- Legacy / deprecated widgets
Qtip: You can still use widgets that don’t reference multiple datasets. Just keep in mind they will only reflect data from the default dataset.
Adding Multiple Datasets to the Same Widget
A few widgets allow you to show data from separate datasets at once. This is done by adding multiple metrics and changing the dataset your metrics reference. From there, you can even break out the data by linked fields, giving you dynamic options for side-by-side dataset comparisons in the same widget.

The only widgets that can show multiple datasets at the same time are line, bar, and table widgets.
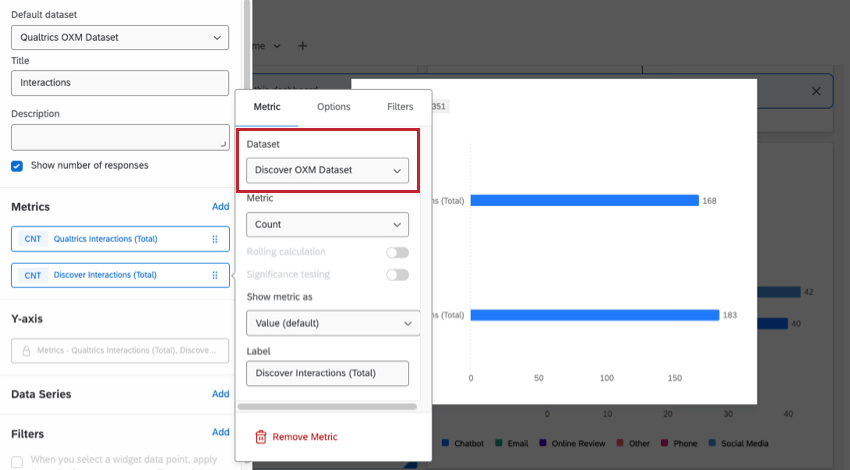
Qtip: You can also set a different metric dataset than primary referenced widget dataset in other widgets. However, only the widgets listed above allow you to add multiple metrics at a time. Only widgets that allow multiple metrics at once can also support multiple datasets at once.
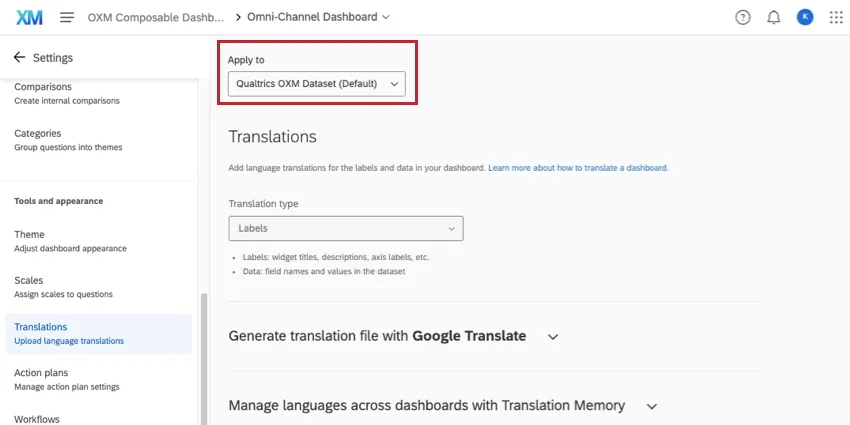
Multiple Datasets in Other Dashboard Settings
In addition to fields, datasets have other features you can customize in a dashboard, such as their custom metrics, benchmarks, and more. When you go to edit these dashboard settings, you can decide which referenced dataset you want to work on. That means these features don’t allow you to create items that are linked between datasets. For example, you can make custom metrics within the same dataset, but not across different datasets.
Dashboard settings where you can navigate between multiple, separate datasets:
Other settings, like theme, workflows, date & time, and action plans, are set for on the entire dashboard, rather than just separately for each dataset.
Controlling Dataset Access
User access is controlled on a dashboard by dashboard basis, not on a dataset by dataset basis. That means anyone with editing access to a dashboard can also access and edit any datasets inside. You can control access to the dashboard and its datasets using roles.
When you restrict data by dashboard fields, you must choose a dataset first. From there, you can choose fields, linked or not, to build data restrictions. If you have multiple datasets in your dashboard, and want to use data restrictions, we recommend making sure those data restrictions use linked fields.
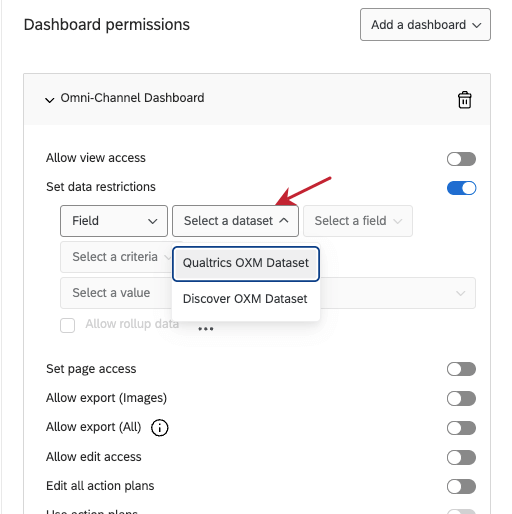

Example: You restrict access to the dashboard using Business Unit. You decide to add another dataset to the dashboard, which has a similar field, Employee Department. You link these fields and add them to the role.
FAQs
How many columns / unique fields can my dataset have?
How many columns / unique fields can my dataset have?
Is there a limit to the number of data sources you can add in each dataset?
Is there a limit to the number of data sources you can add in each dataset?
How many dashboard datasets can I create?
How many dashboard datasets can I create?
How many times can I use the same data source in a dashboard dataset?
How many times can I use the same data source in a dashboard dataset?
What’s the difference between linking, merging, or joining fields?
What’s the difference between linking, merging, or joining fields?
Linking fields ensures different fields from multiple datasets are mapped to each other. You should use this option to create a simple link between datasets. For example, if all you want to do is show data from different sets side by side in the same dashboard, or add a few shared filters for this data, then we recommend linking fields.
Joining fields combines multiple data sources within the same data model, using one field as a “key” to identify records that should be combined. You should use this option to add context to data. For example, if you have multiple stores you manage and collect feedback on, you can have a location directory with important information about all of the stores. Your surveys would then only need the store ID collected with each response. The join can be used to enrich the survey responses with this store data.
When I add multiple datasets to my dashboard, does it matter if they are data mapper or data model sets?
When I add multiple datasets to my dashboard, does it matter if they are data mapper or data model sets?
What’s the difference between data sources and datasets?
What’s the difference between data sources and datasets?
Learn more about these key terms.
Can I use multiple datasets with existing dashboards?
Can I use multiple datasets with existing dashboards?
How many datasets can be added to a dashboard?
How many datasets can be added to a dashboard?
That's great! Thank you for your feedback!
Thank you for your feedback!