-

Qualtrics Platform -

Customer Journey Optimizer -

XM Discover -

Qualtrics Social Connect
Idea Screening XM Solution
About the Idea Screening XM Solution
The Idea Screening XM Solution allows you to screen a set of ideas to discover which ideas resonate the most with your respondents. This solution targets early-stage innovation efforts to help you understand which ideas and product lines have the most potential before investing further in their development.
Methodology
Developed by Qualtrics ProductXM scientists, Idea Screening is a guided project that can help organizations understand their customers’ product preferences. The Idea Screening setup asks for a high-level description to provide context around your set of ideas, then asks for a simple text description of each idea.
Gut Reaction Question
MaxDiff is a powerful methodology that is used to assess the relative preference of your respondents for your set of ideas. The first part of the survey will ask respondents to give their gut reaction to each idea. They are given a short period of time to review the idea, then a short period of time to answer questions about their gut feeling about the idea. If your respondent doesn’t answer within five seconds, the survey will automatically advance to the next question.
Qtip: If more than five ideas are configured in the setup, additional MaxDiff questions and analysis will be included.
Detailed Idea Screening Questions
Next, respondents will be asked to give a more detailed breakdown of how much they like or dislike each idea, and how new or different each idea is.
Anchored MaxDiff Questions
MaxDiff is a powerful methodology for assessing relative preference of respondents across the set of ideas. When you include eight or more ideas, the survey template will automatically include Advanced MaxDiff methodology, which will add anchored MaxDiff questions. In this case, the user will be asked to choose their most and least preferred idea, and they’ll be asked a follow up question assessing idea importance.
Creating an Idea Screening Survey
- Select Catalog from the global menu.
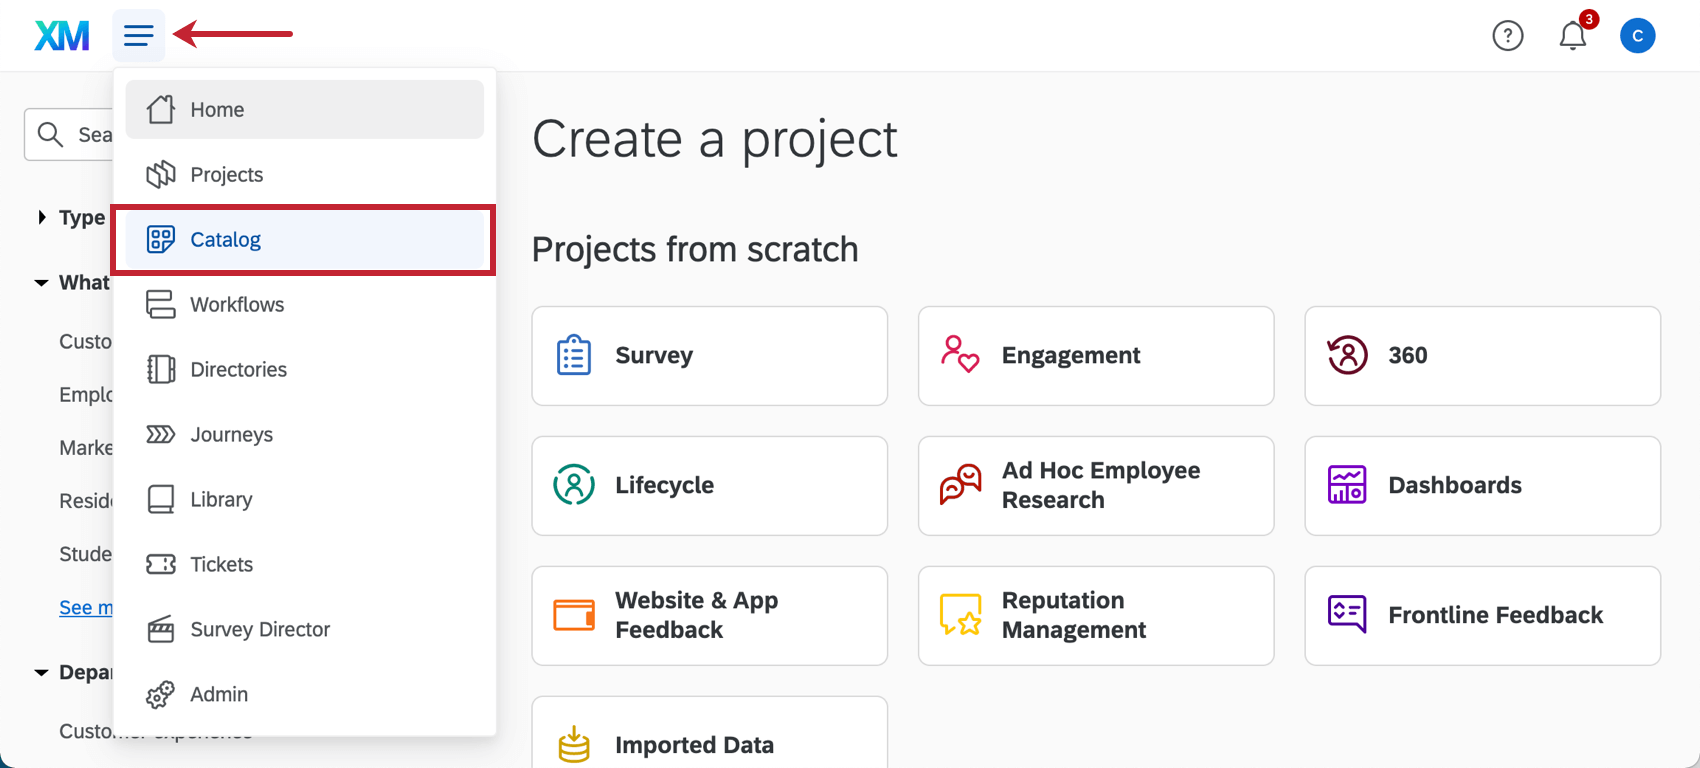 Qtip: A project can also be created from the Projects or Homepage.
 - Scroll, filter, or search as needed to find the correct project type. This type of project can be made under ProductXM or Strategic Research.
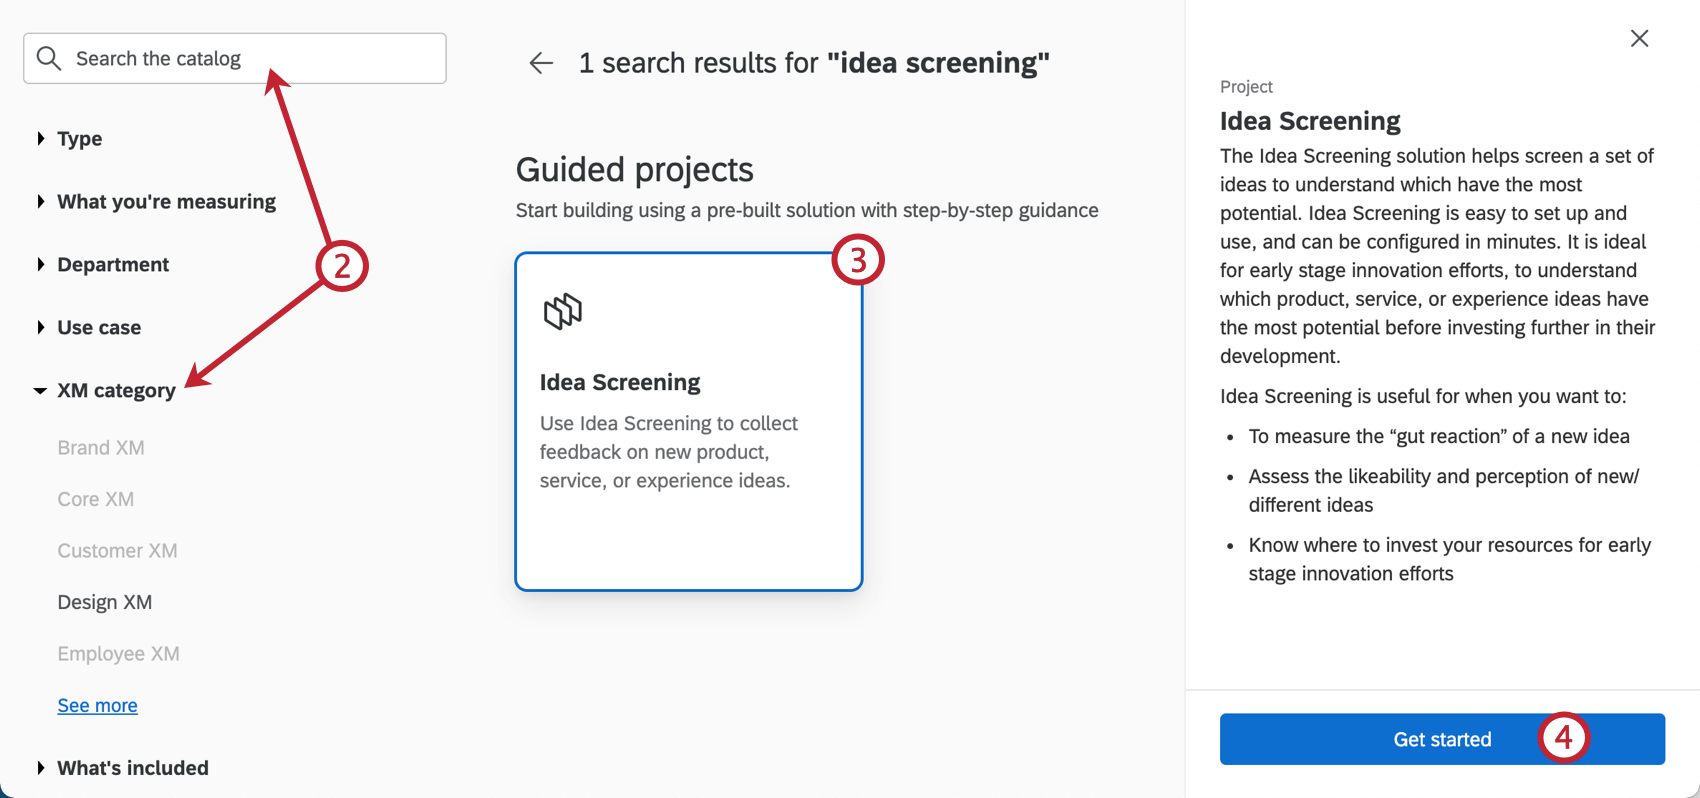 Qtip: This choice does not affect the Website & App Feedback features you have access to.
 - Select Idea Screening guided project.
- Click Get started.
- Name your project.
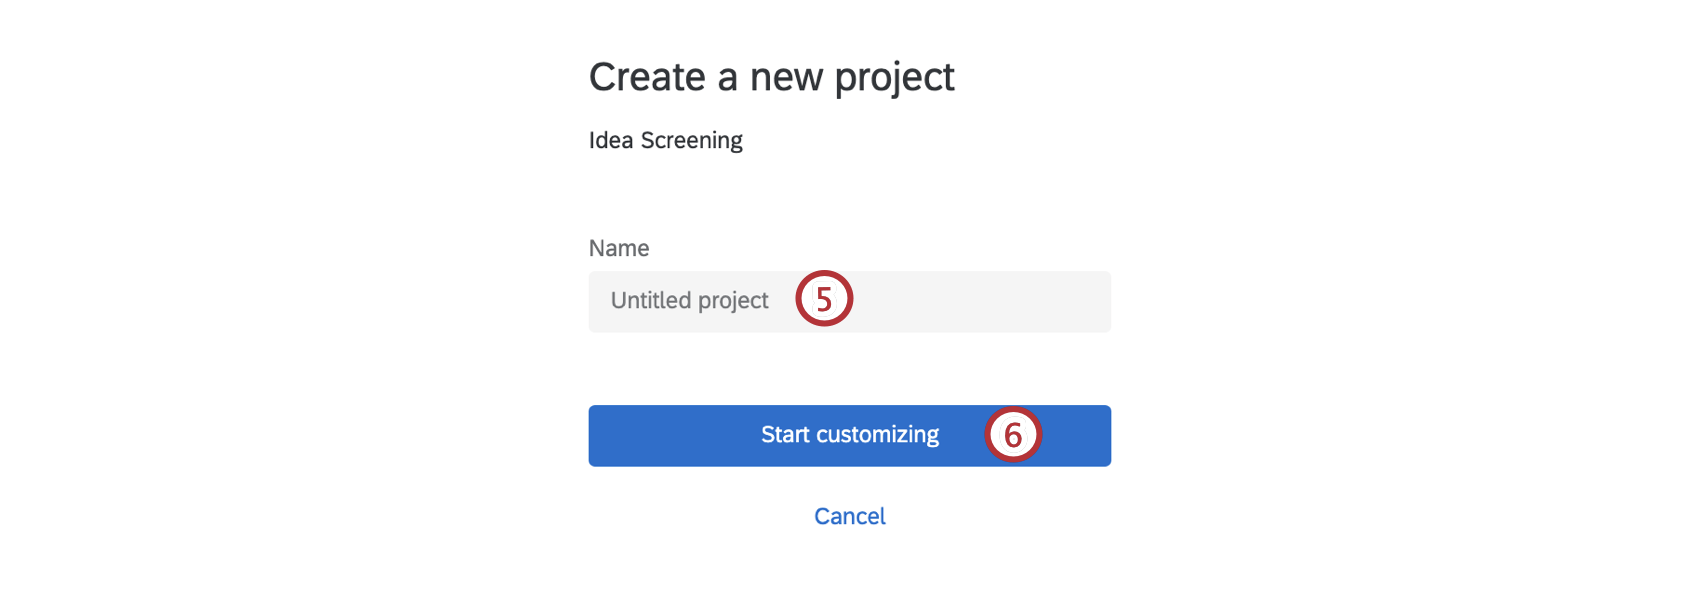
- Click Start customizing.
- Enter an introduction to explain the purpose of the survey to your participants.
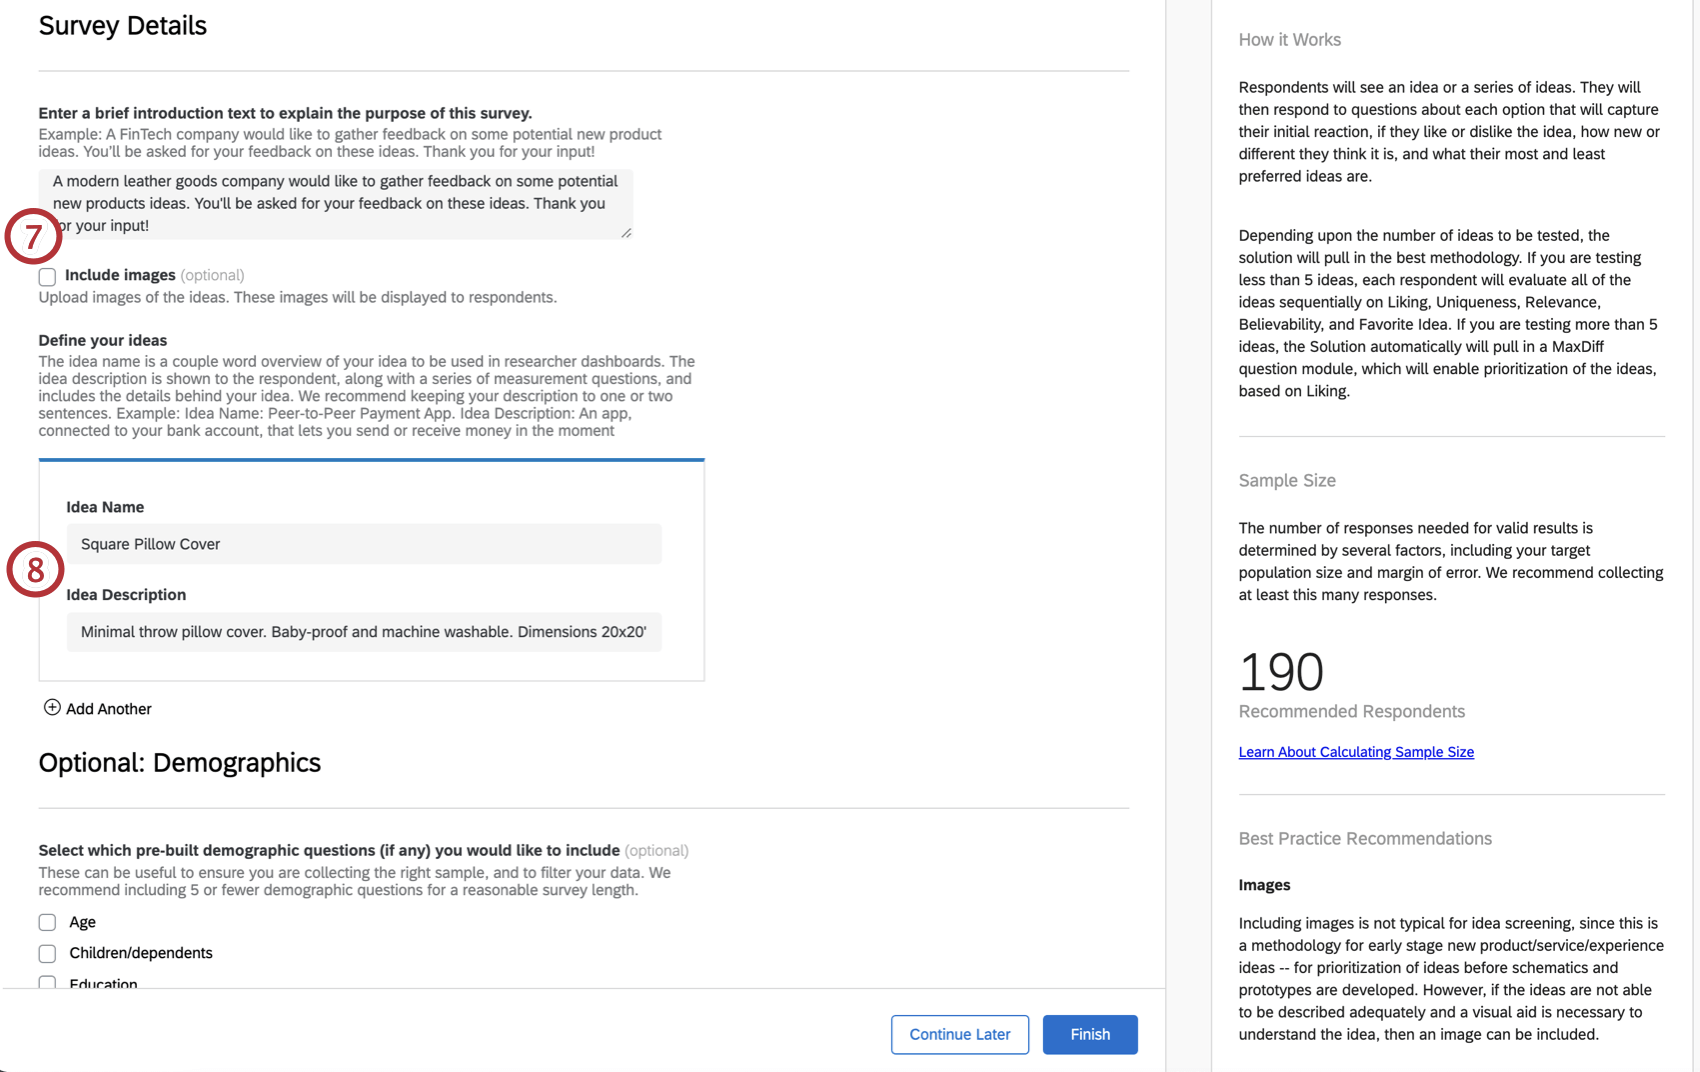
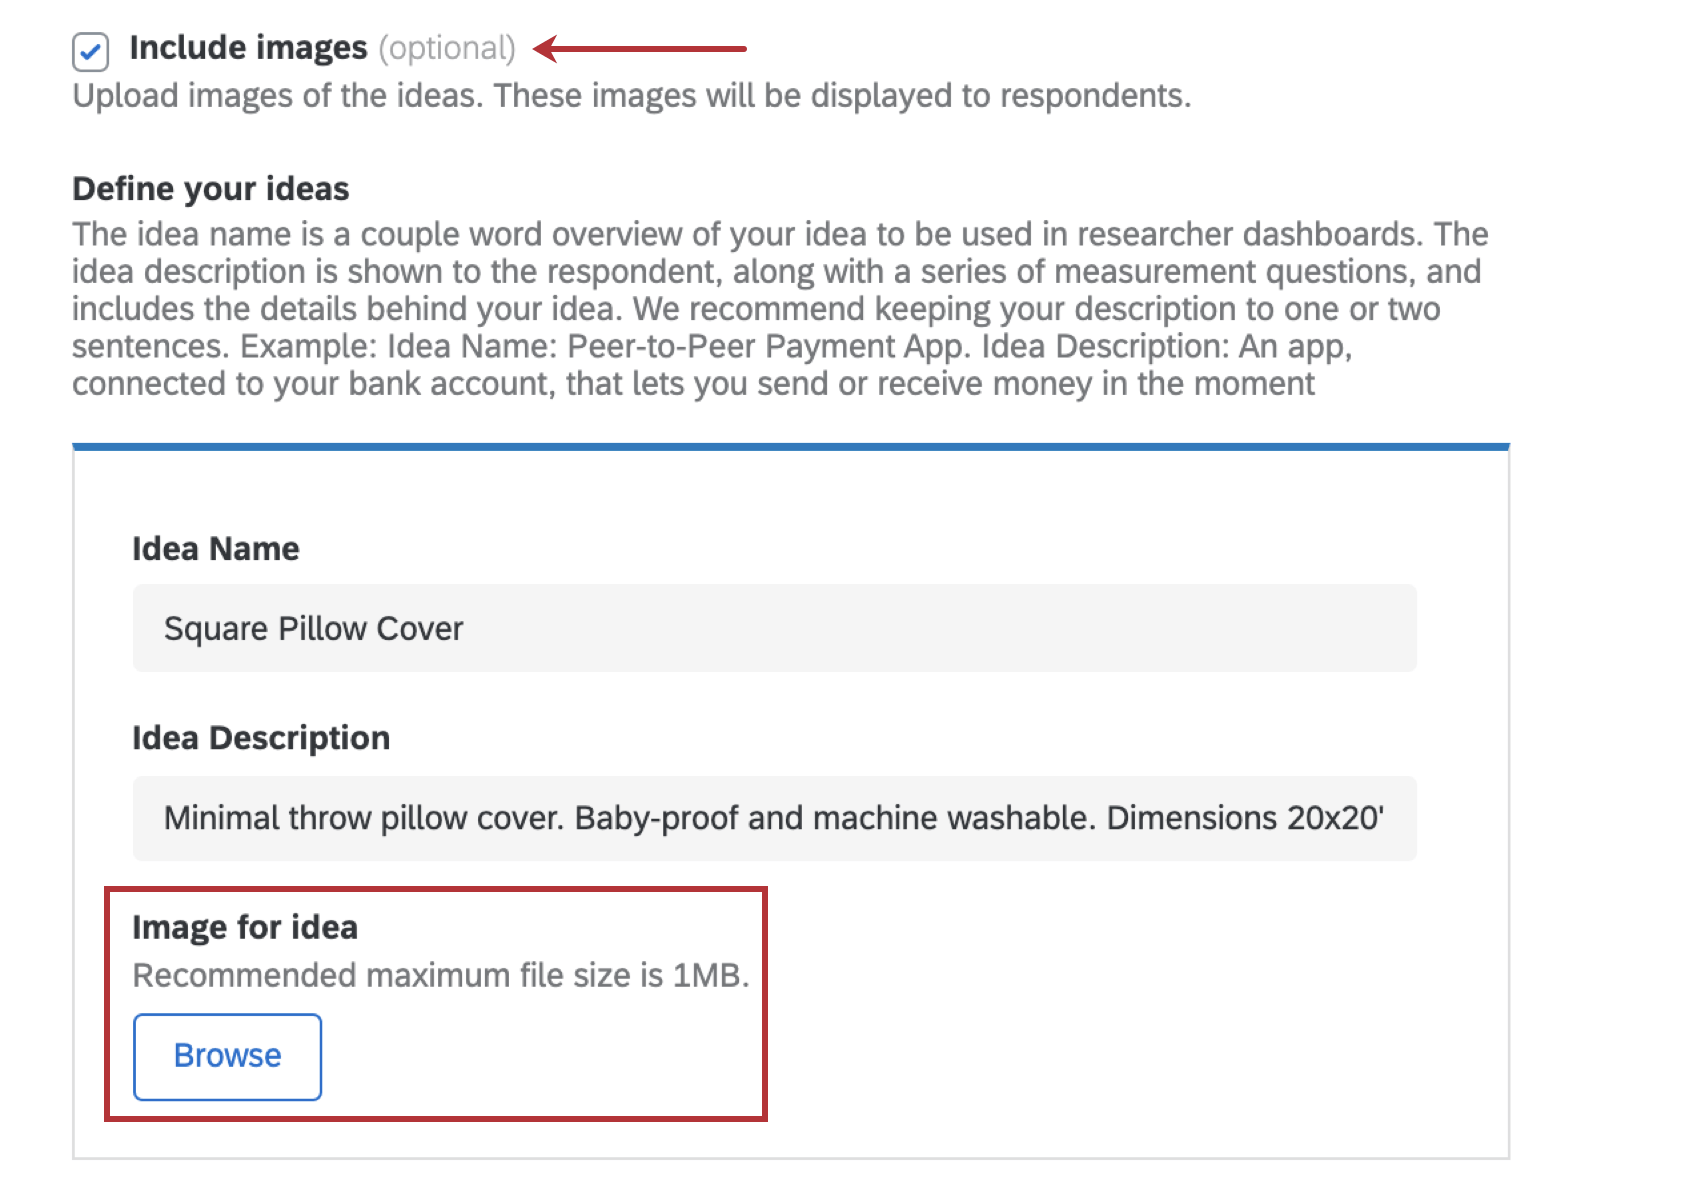
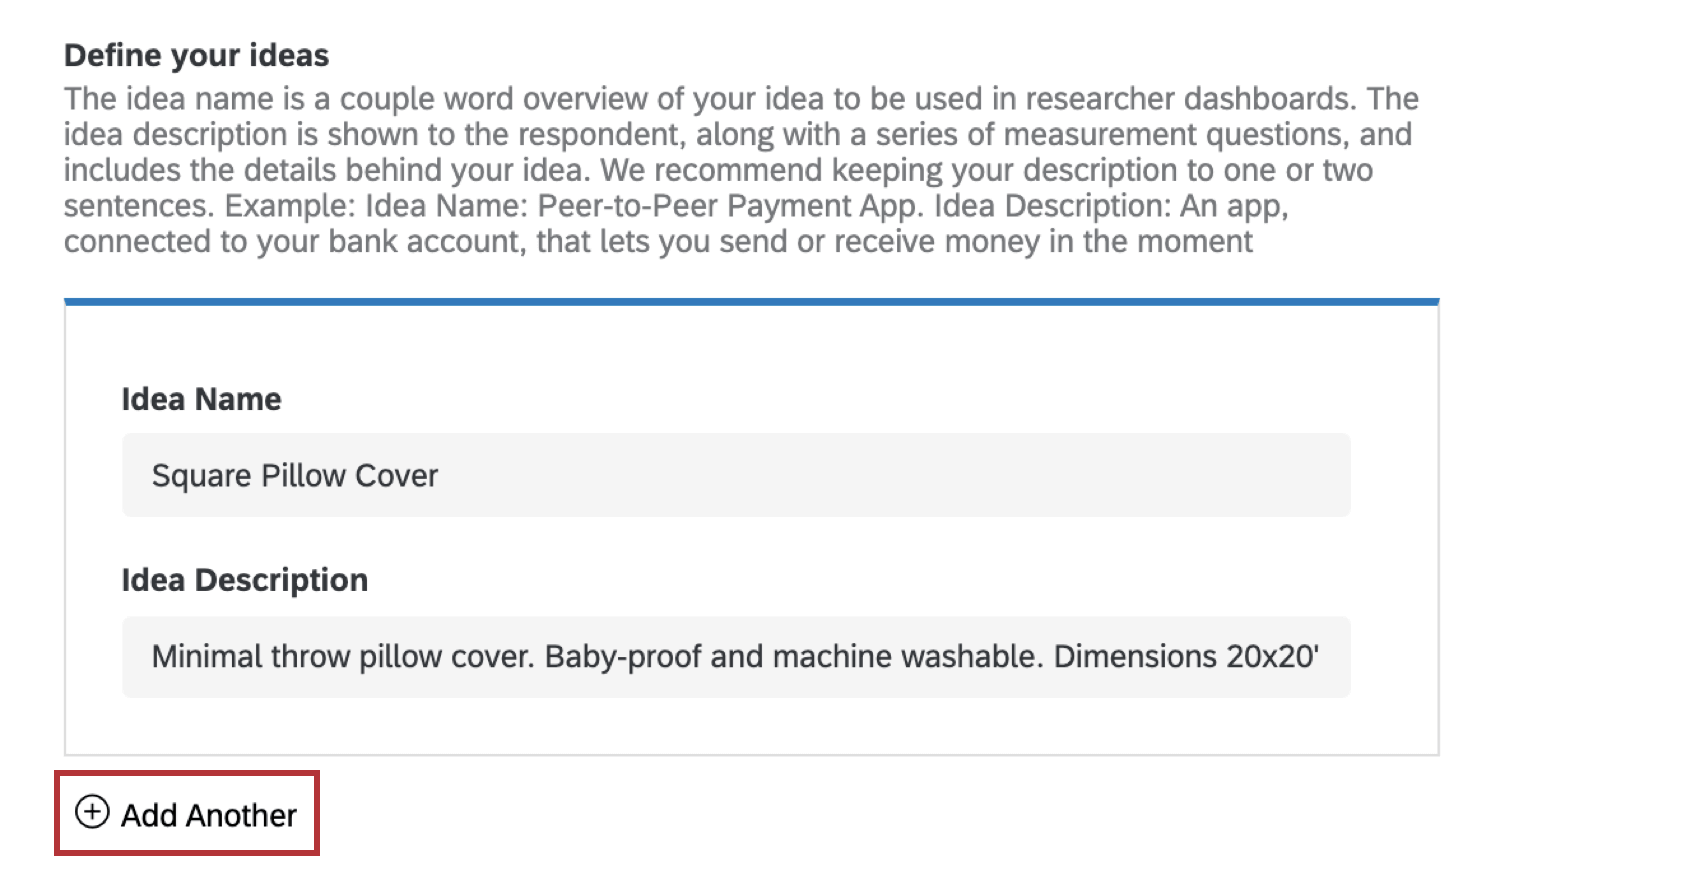
- Enter an Idea Name and Idea Description to define your ideas. We recommend including a 1 to 2 sentence description for each idea.
Qtip: If you would like to include images with each of your ideas, select Include Images. Once this option is selected, you’ll need to attach an image when you define each idea. Just click Browse to include your image! The maximum file size is 1MB.
 Qtip: Click Add Another to add additional ideas.
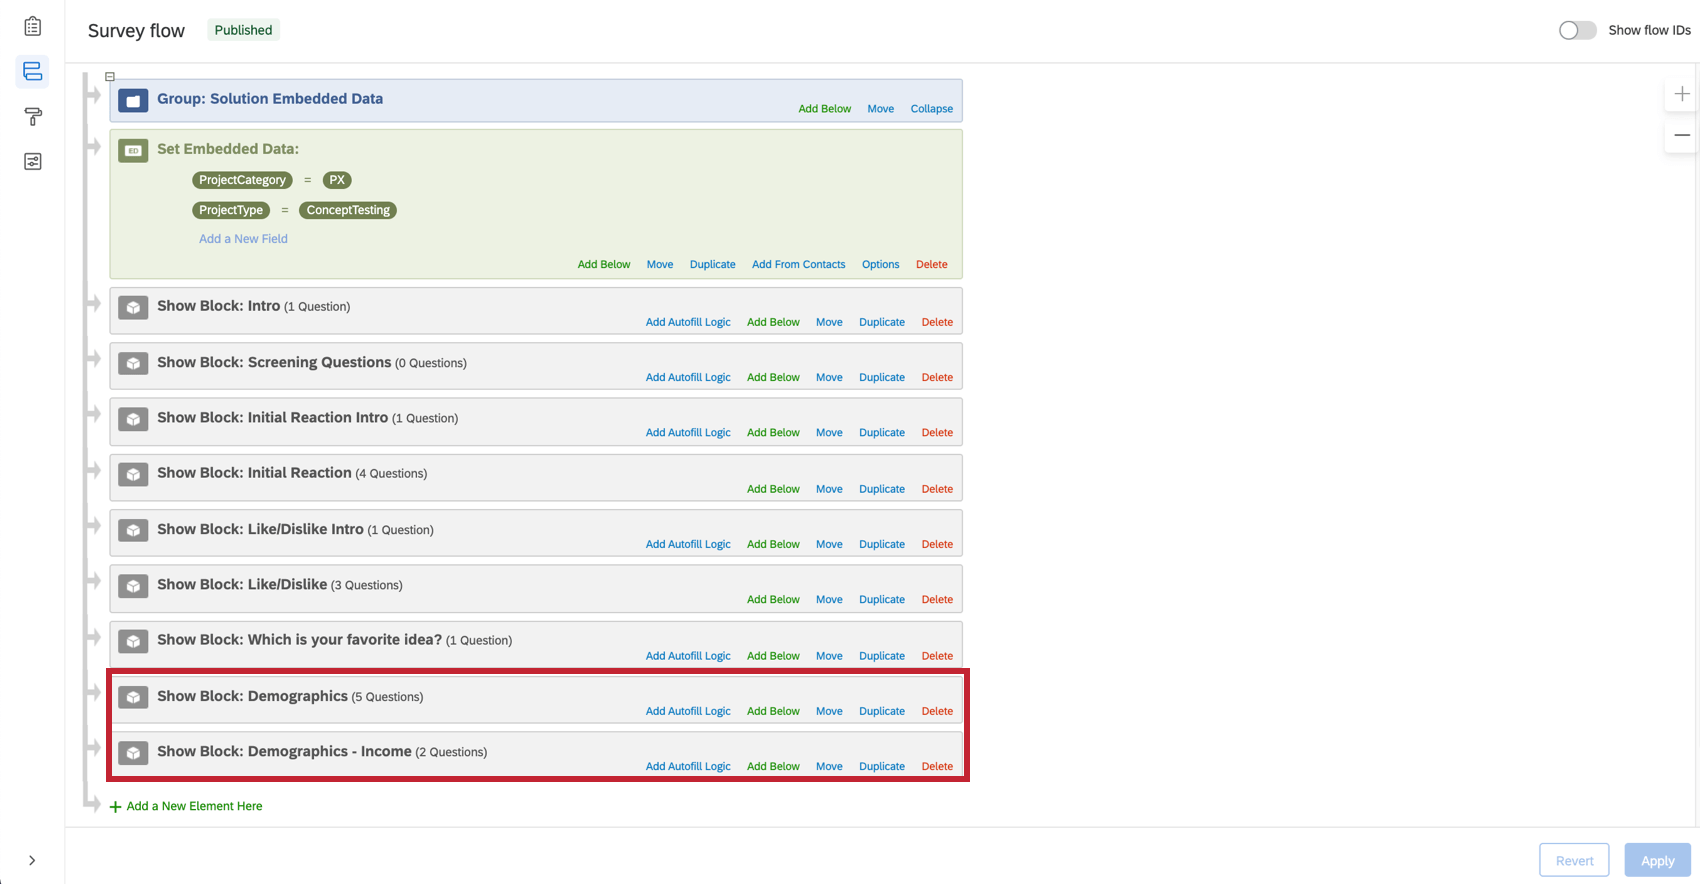
- Select additional demographics to include as questions in the survey.
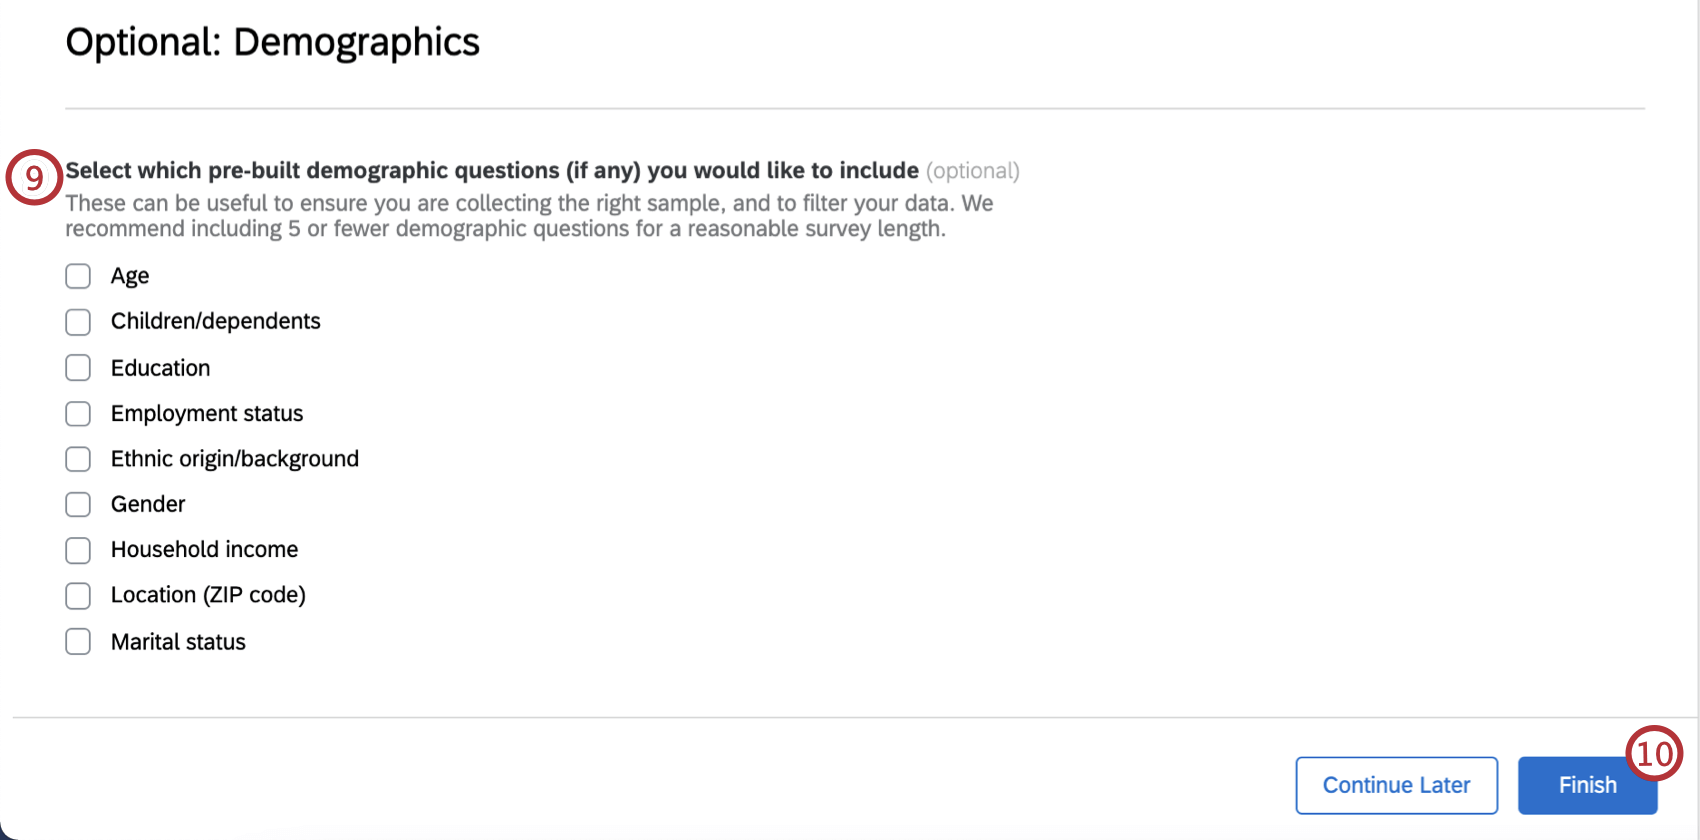 Qtip: If you are collecting demographics data, we recommend including 5 or fewer demographic questions for a reasonable survey length.Qtip: The selected demographics questions will be added in a block at the end of your survey. According to our ProductXM Scientists, it is best practice for demographics questions to come at the end of the survey, rather than at the beginning. When people have to answer specific information about themselves upfront, they feel less anonymous. This can result in people answering less truthfully or providing more socially desirable answers.
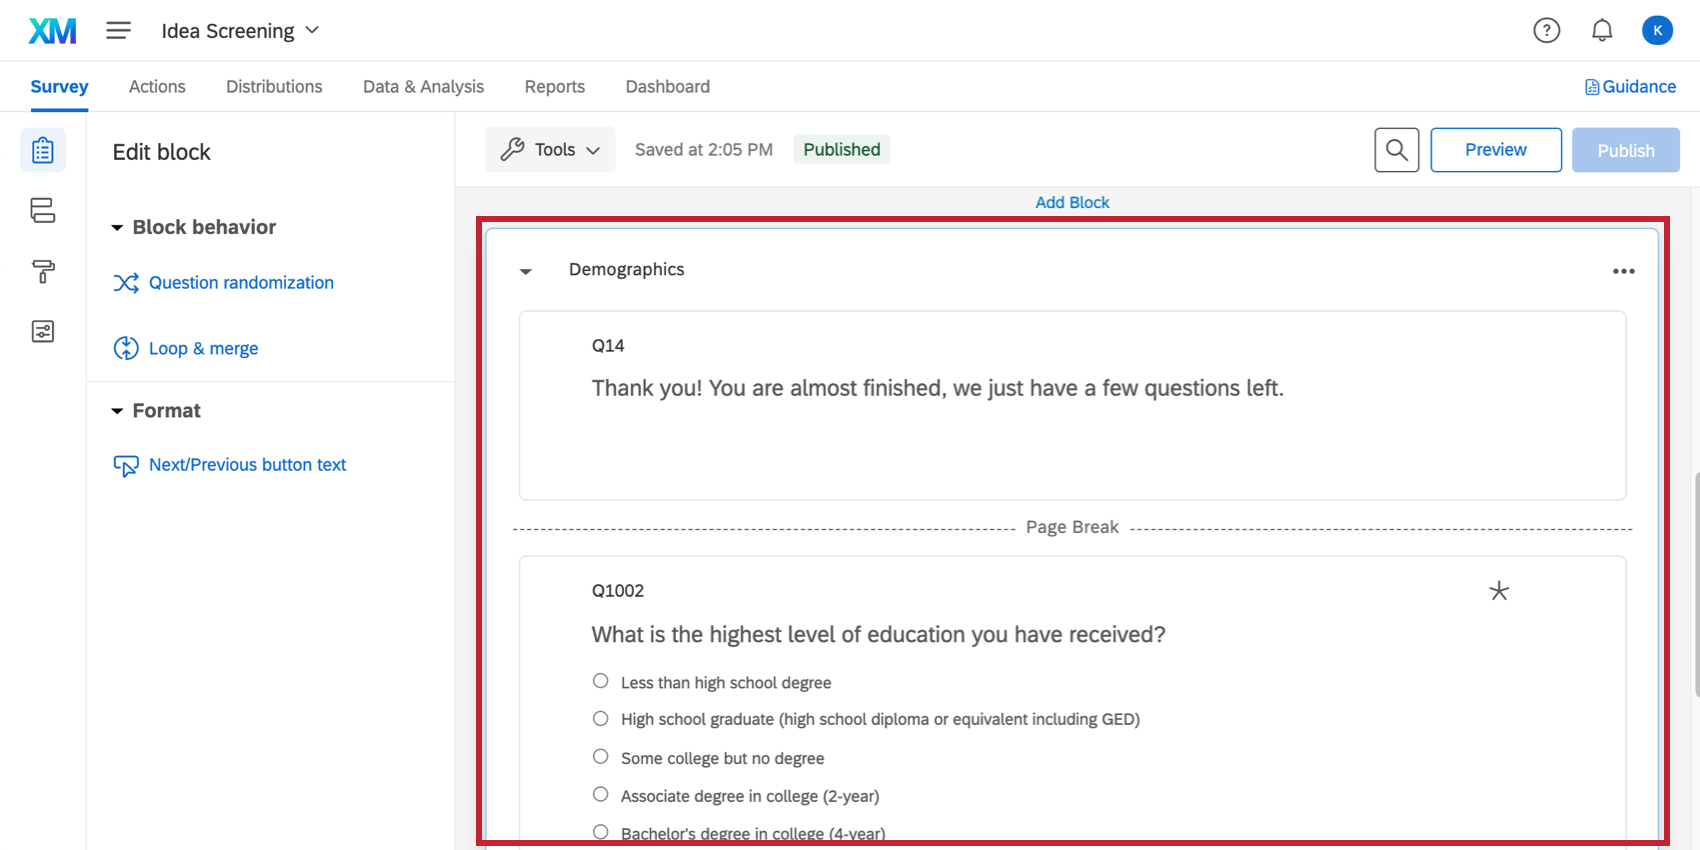
- Click Finish.
Adding Screening Questions
When gathering feedback on your ideas, our ProductXM Scientists recommend that you look to the broadest possible pool of potential customers. You can screen your ideas with a simple question like, “Have you used this product category in the past xx months?” This will ensure that you’re surveying a wide audience, but you’re still making sure that your responses will be from potential customers. This section will detail how to add relevant screening questions to your survey in order to determine whether your respondents meet the right criteria to take part in the study.
- You will be navigated to the survey builder.
- Click the dropdown arrow next to the Screening Questions block. The Guidance menu on the right side will provide additional information about screening questions.
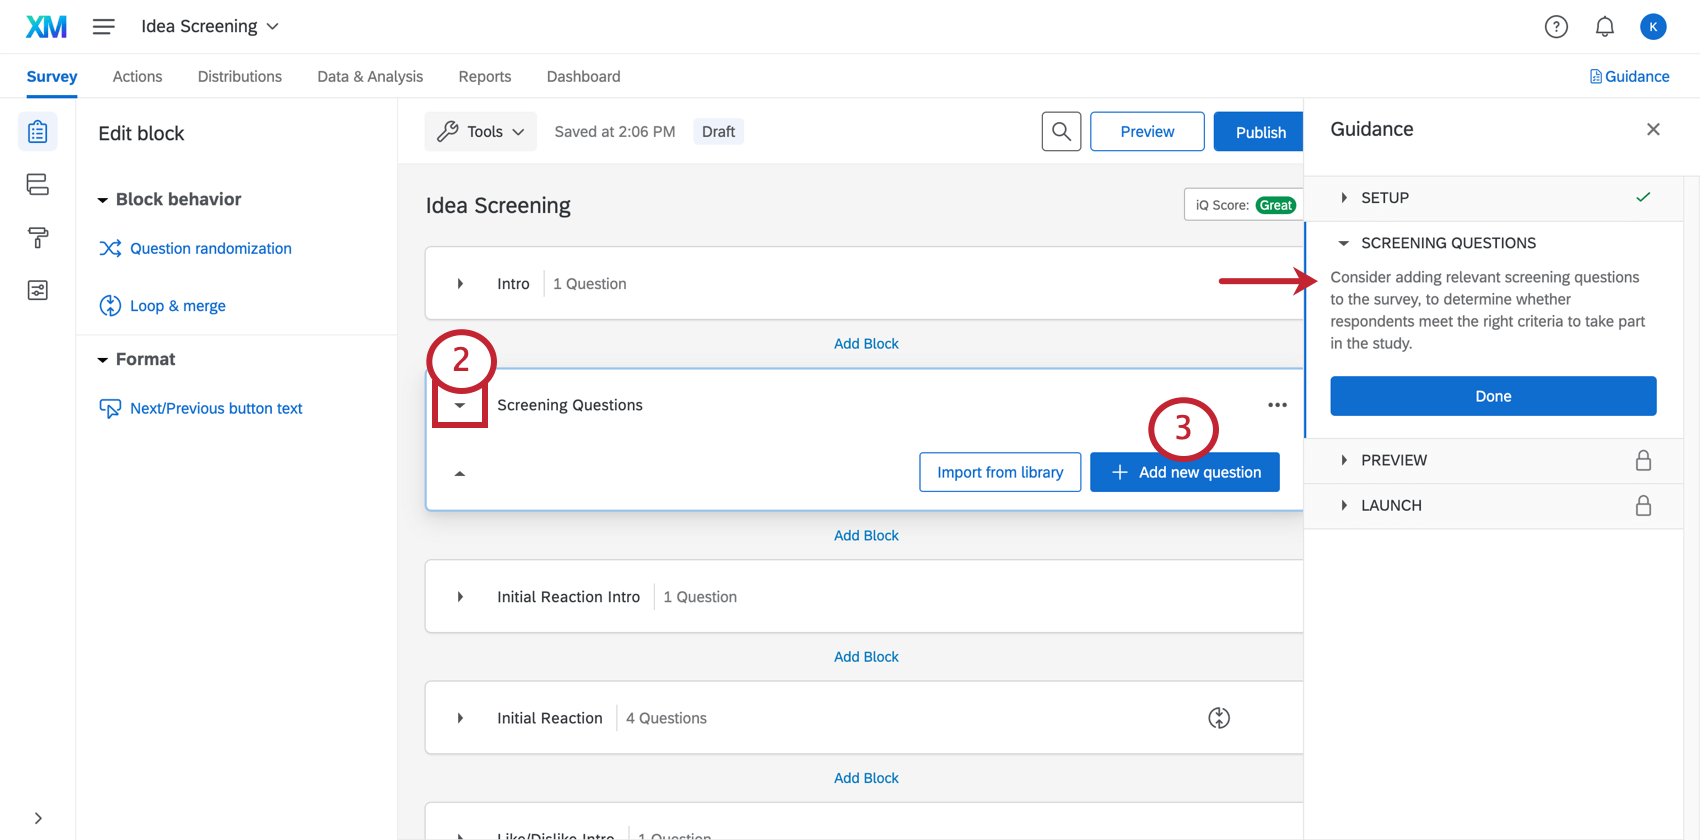
- Select Create a New Question.
- Create your screening question(s). See Creating Questions for more details.
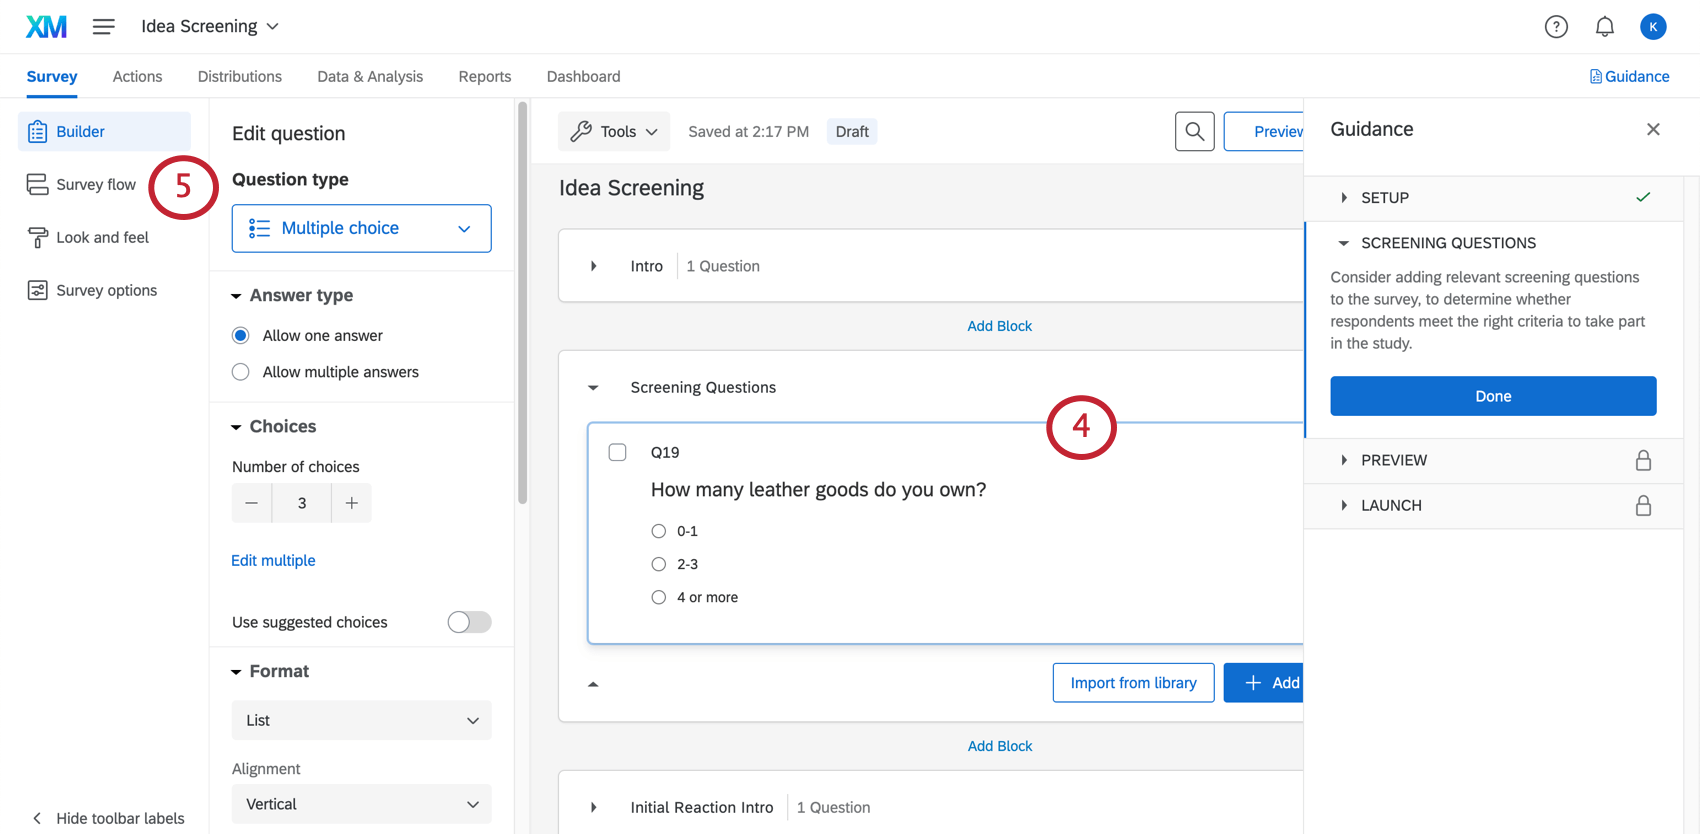
- Navigate to the Survey flow. You’ll be using branch logic in the survey flow to screen out participants that don’t meet the criteria in your screening question(s).
- Click Add Below on your Screening Questions block.
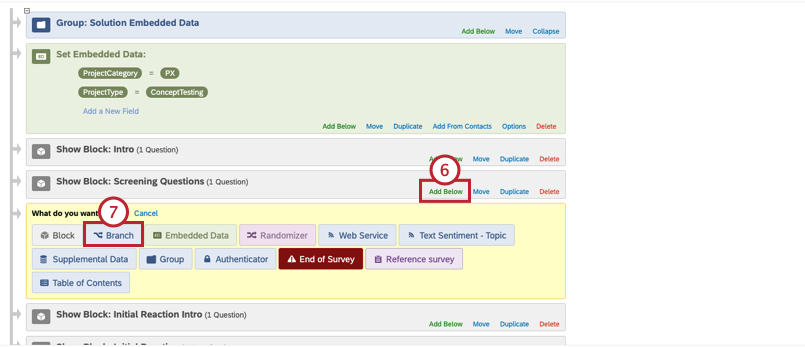
- Select Branch.
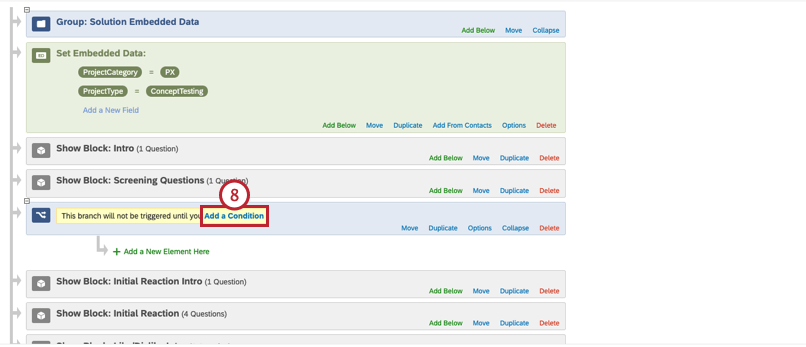
- Click Add a Condition.
- Define what your logic will be based on as Question, since you’re screening out respondents based on your screening question(s).
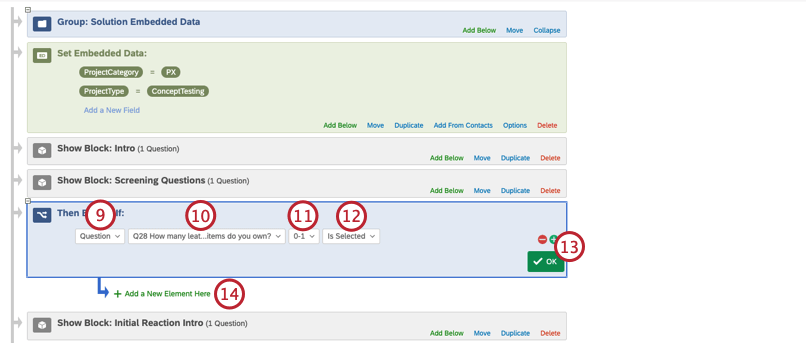
- Select the question you would like your logic to be based on. In this case, you should select the question you’re using to screen respondents out with.
- Select the choice that you would like to screen out.
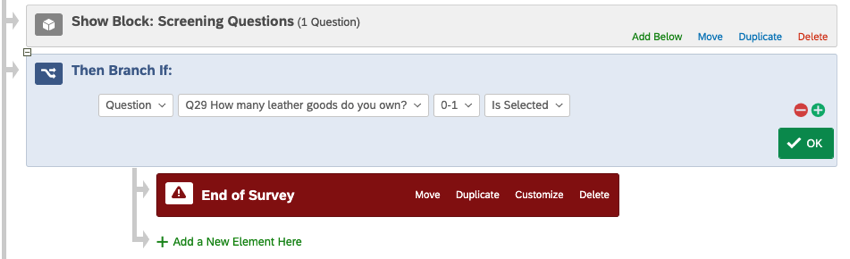
Example: In this example, we would like to screen out respondents who don’t buy leather. After the Screening Questions Block, there is a branch that will end the survey if the respondent says that they only own 0-1 leather goods. This will ensure that the opinions of people who don’t own leather will not be recorded in the Idea Screening survey.
 Attention: Make sure that you’re careful about how you order your blocks and branches. If your elements are incorrectly ordered, they may not work properly. We recommend following the format of the examples provided!
 - Set the dropdown to Is Selected.
- Click OK.
- Click Add a New Element Here.
- Select End of Survey. See End of Survey Element for more details, as well as for additional Customization Options.
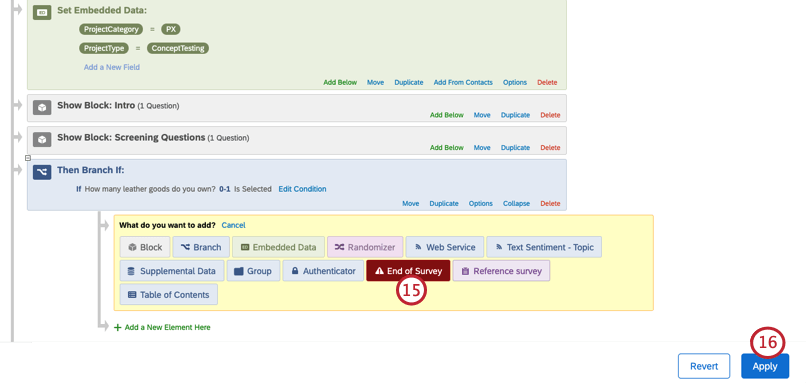
- Click Apply.
- Click Done.
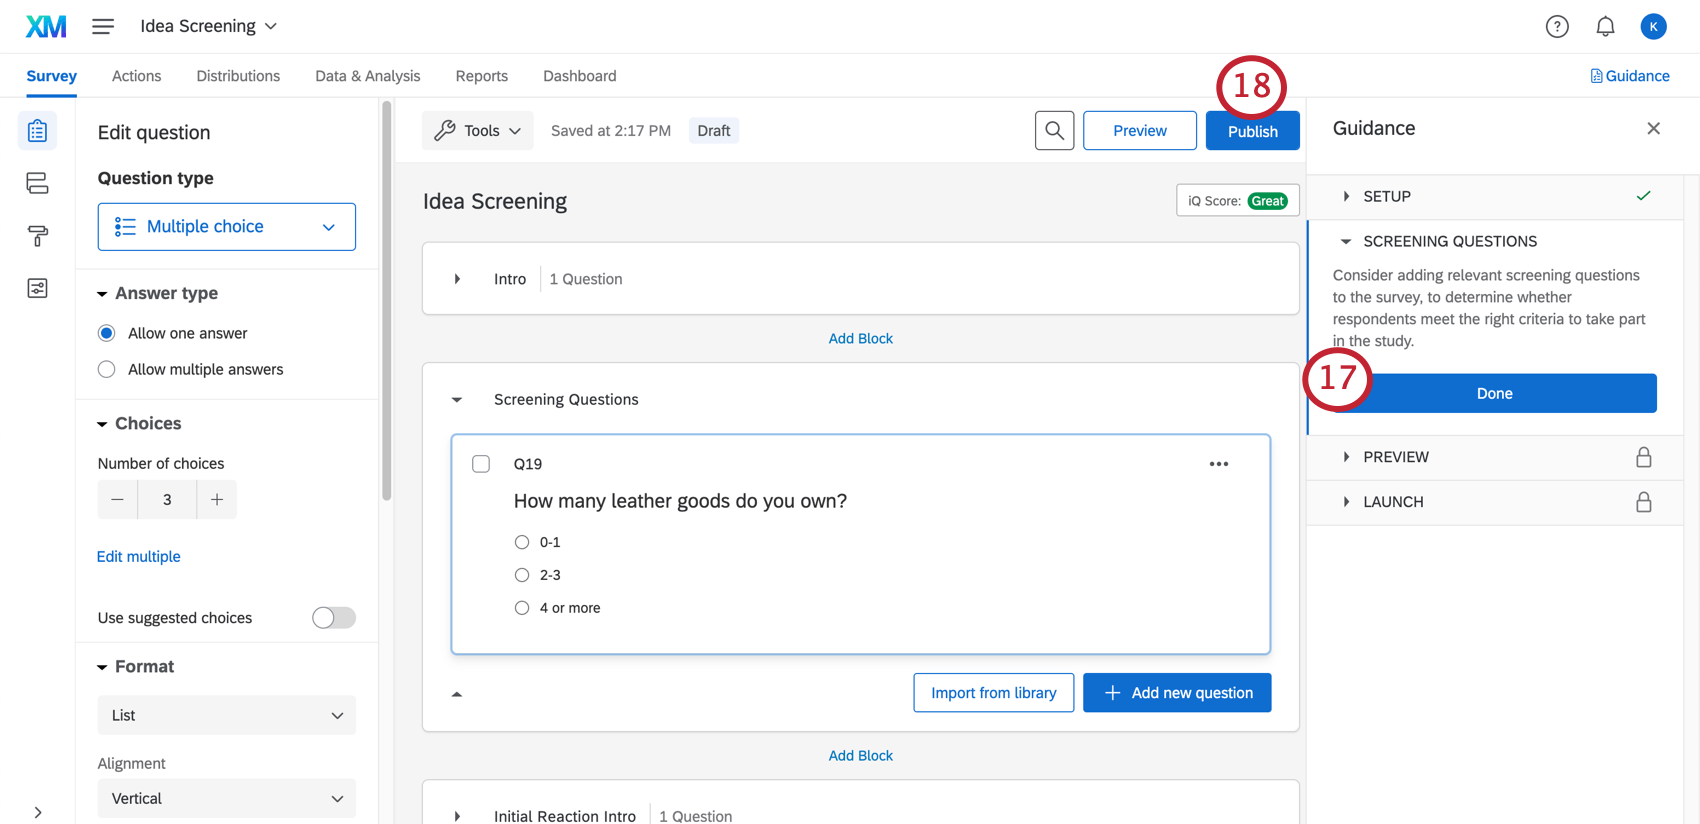
- Publish your survey.
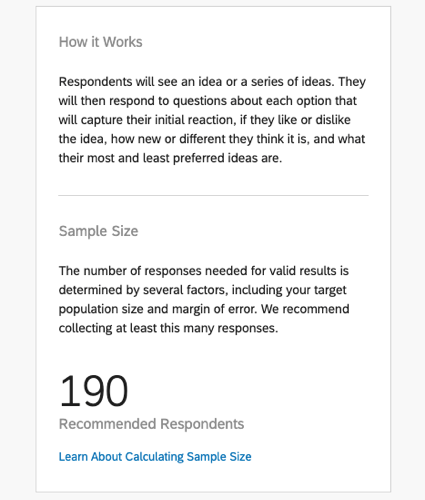
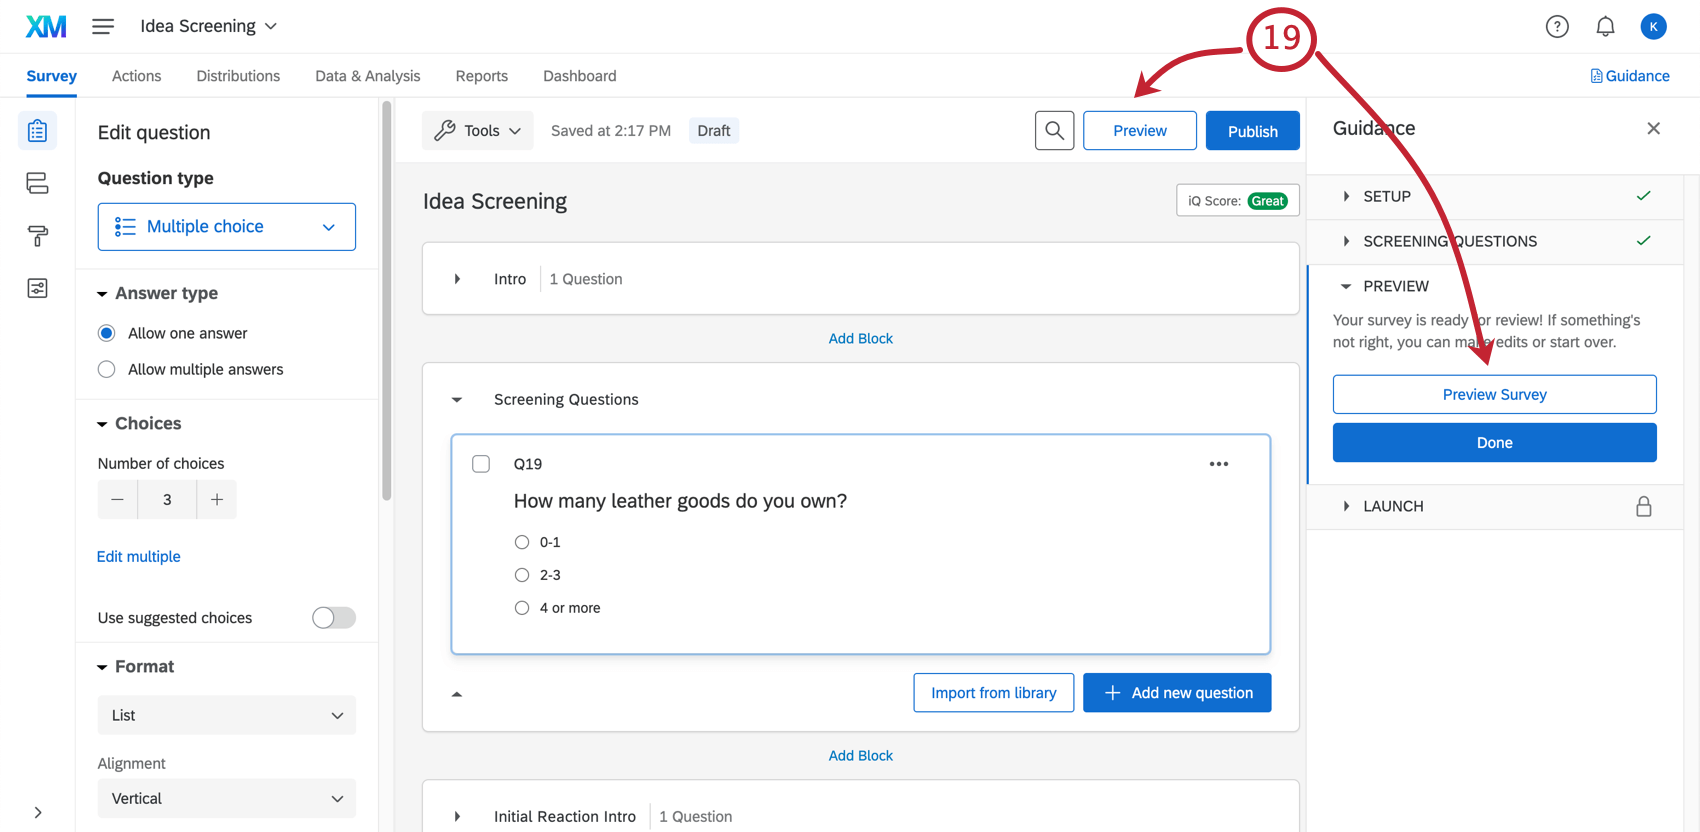
- Review your survey. You can either click the Preview button at the top of your survey, or select Preview Survey in the Guidance section to preview your survey. See Preview Survey for more details.
Creating a Customer Contact List
File Requirements
Contact lists should always be a file saved in one of the following formats, even if you’re using an example file we provided:
- CSV (Comma Separated Values) with UTF-8 encoding
- TSV (Tab Separated Values)
Note that the maximum file size for a contact list upload is 100 MB.
Information to Include in the File
The List of Available Contact Fields has information on how to format certain required fields, such as Email, FirstName, and LastName.
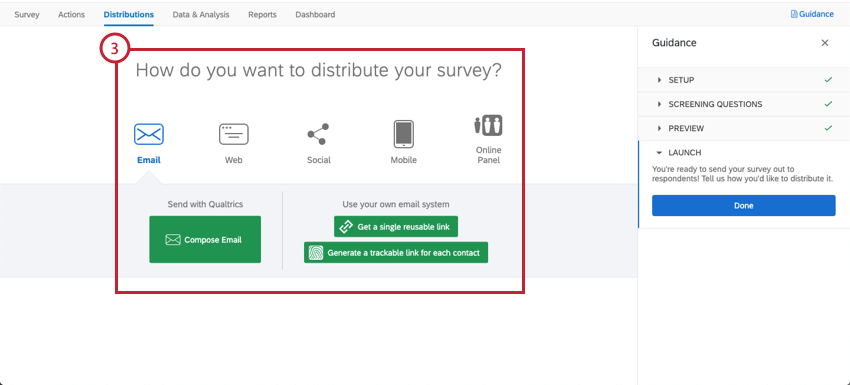
Distributing Your Idea Screening Survey
Once you are finished with survey edits and your contact list is ready, it’s time to distribute your survey.
- Make sure you have published any survey edits.
- Click Select Distribution in the Guidance or Distributions in the upper-left.
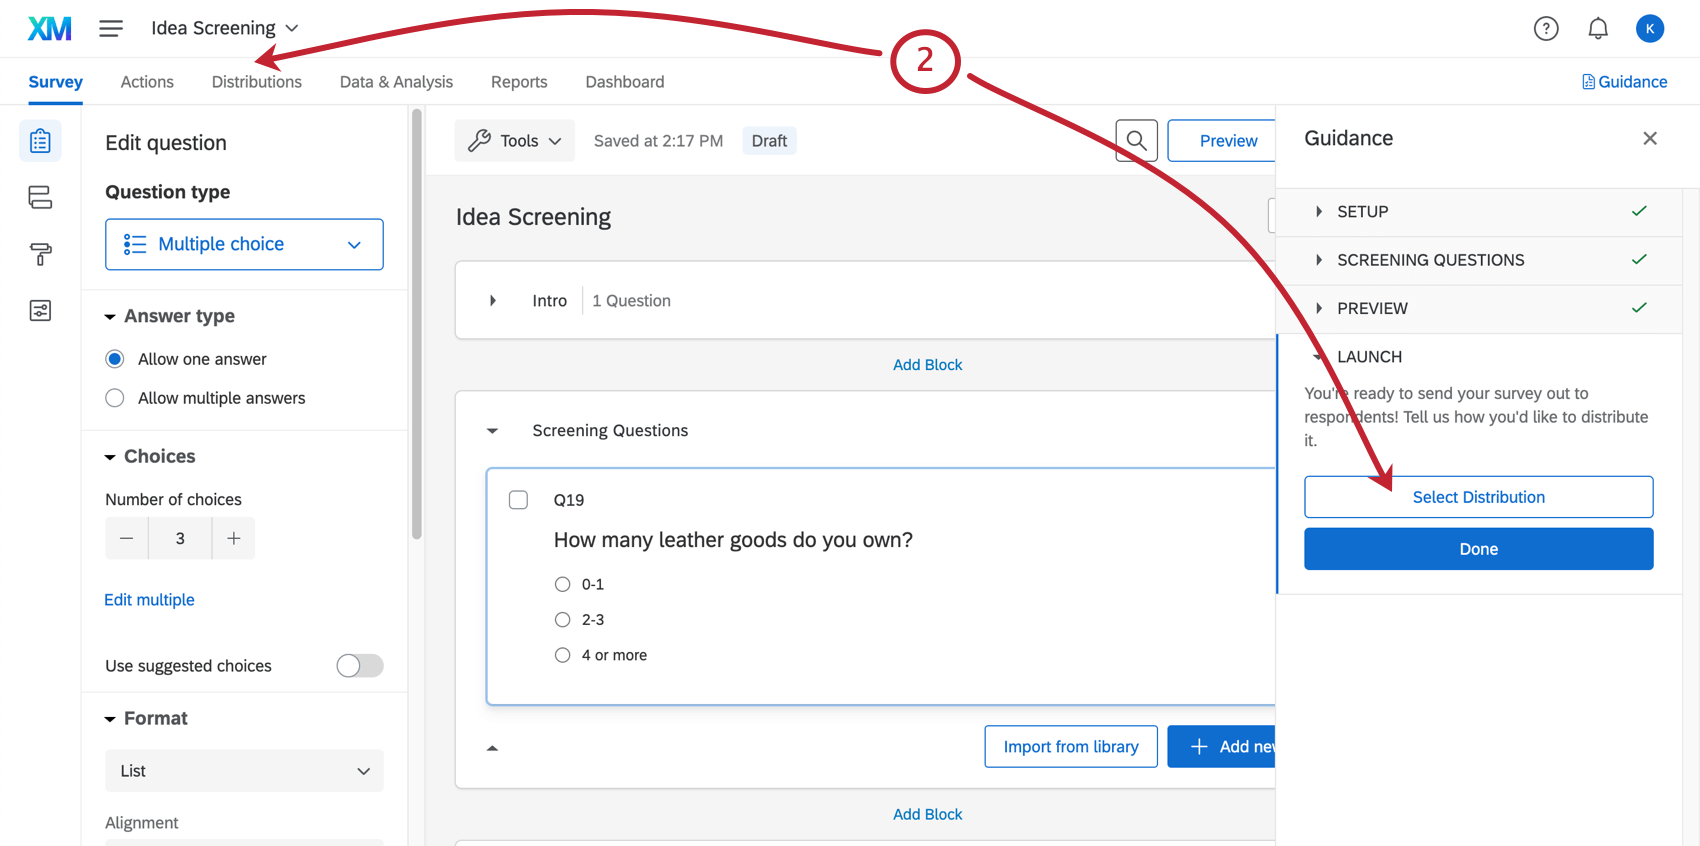
- Select a distribution type. See Distributions for more details.
Dashboards
Our XM Scientists have developed a special dashboard for this guided project. The Idea Screening dashboard has 2 built-in pages for you to view: the Summary dashboard and the Idea Breakdown dashboard. These dashboards will give an overview of your results, and they will be ready to share as soon as you have collected data.
Summary
The Summary page shows the MaxDiff preference share data from the project, the average utility of each item, and rankings for each idea. Your ideas will be ranked according to their gut reaction, favorite idea, top 2 like/dislike, and top 2 new/different ideas.
Idea Screening Widgets
This section explains each of the built-in widget configurations available in the Idea Screening dashboard.
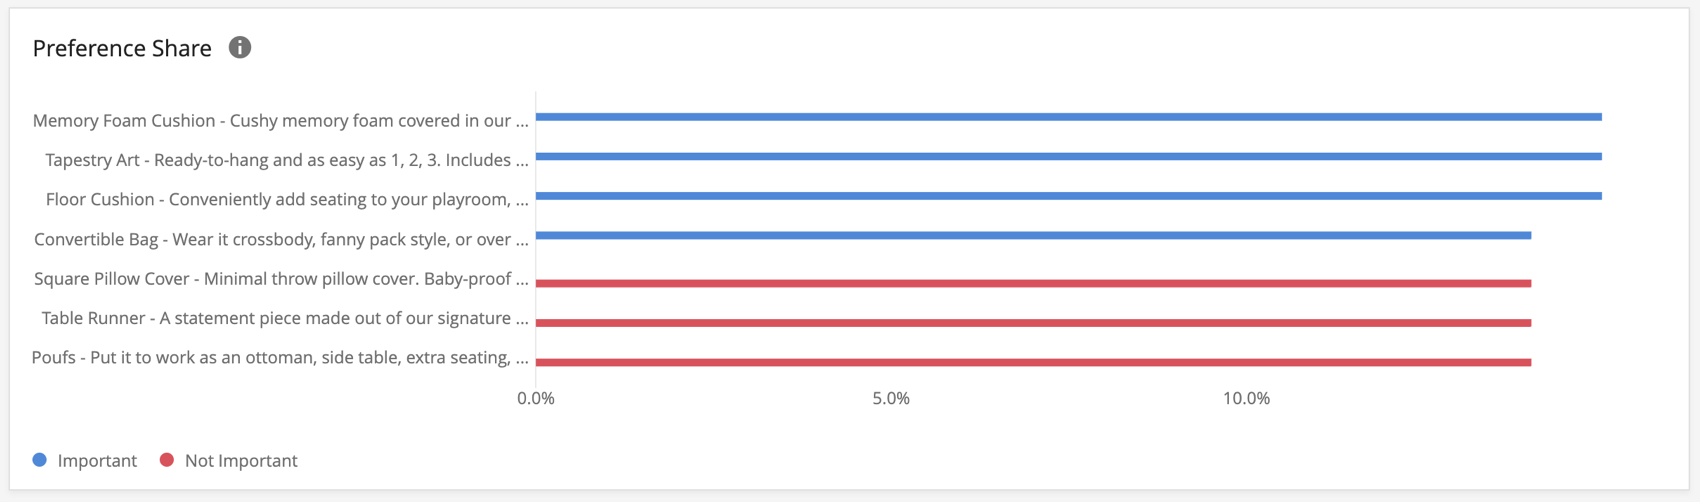
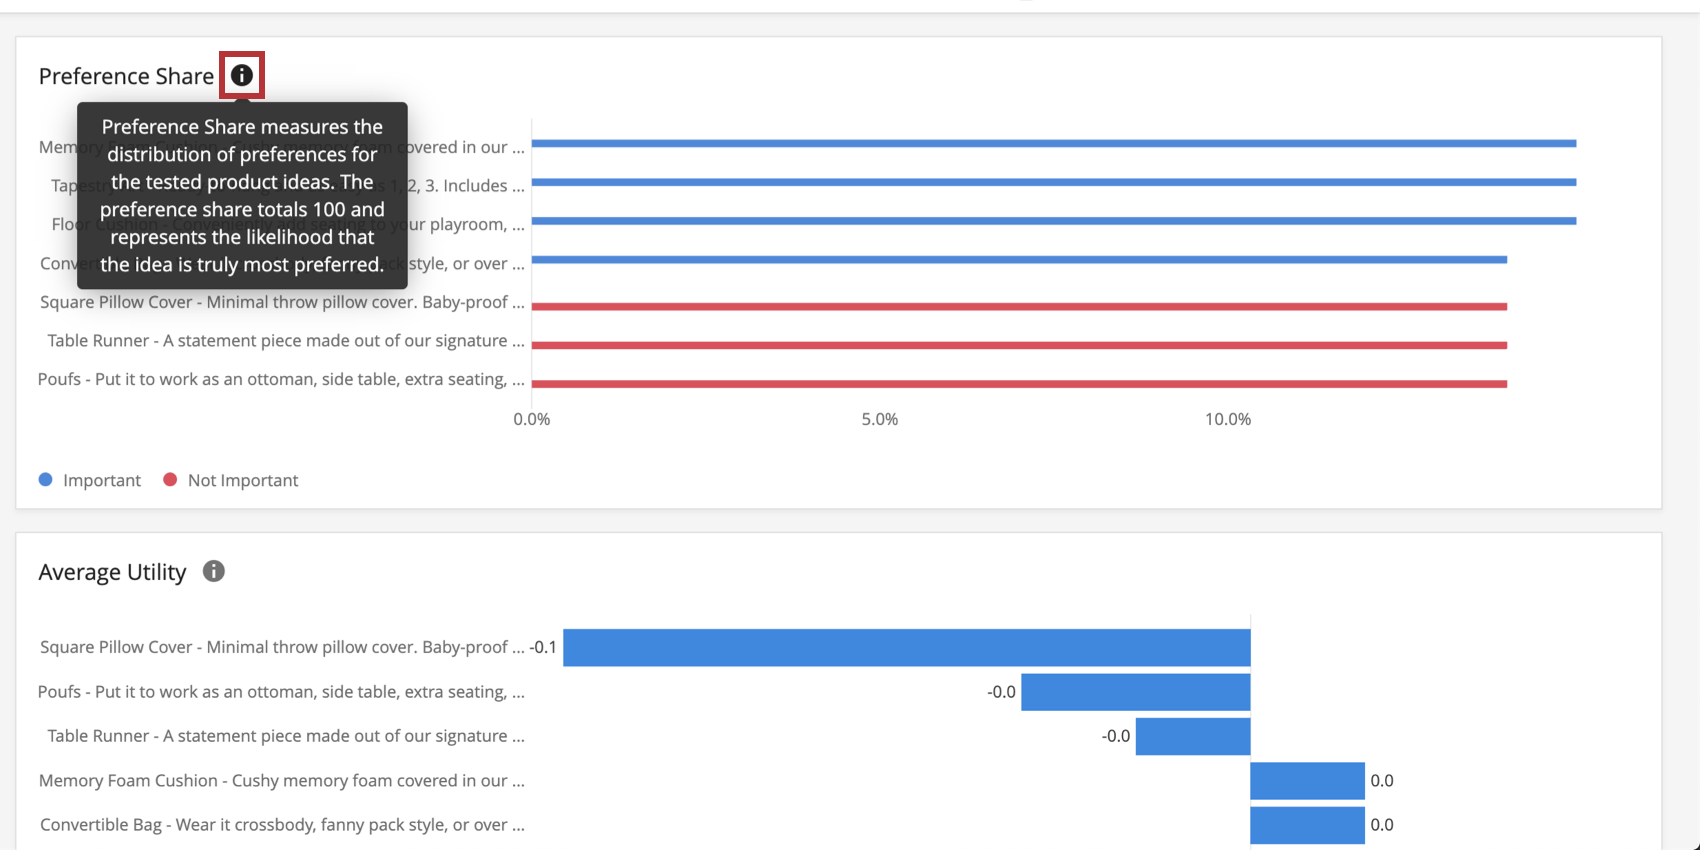
- Preference Share: Measures the distribution of preferences for the tested product ideas. The preference share totals 100 and represents the likelihood that the idea is truly most preferred.
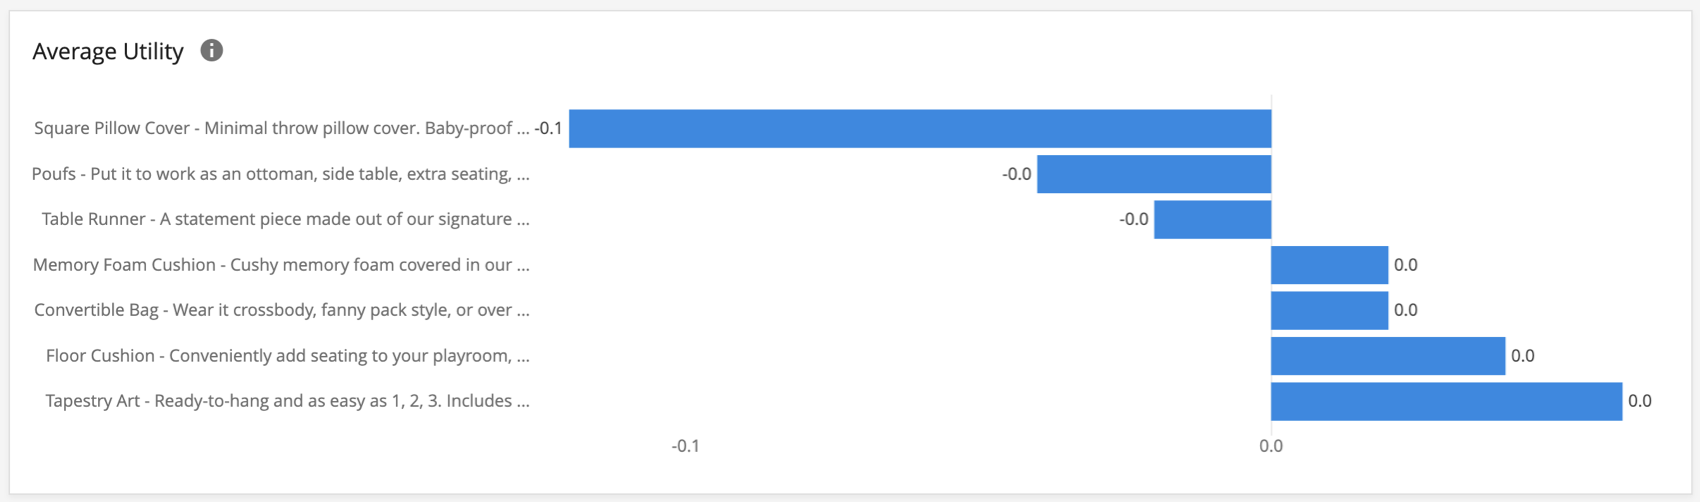
- Average Utility: The direct average calculation across respondents’ individual utility scores. These coefficients are derived from a Hierarchical Bayesian model and reflect the relative preference and importance of the ideas being tested.
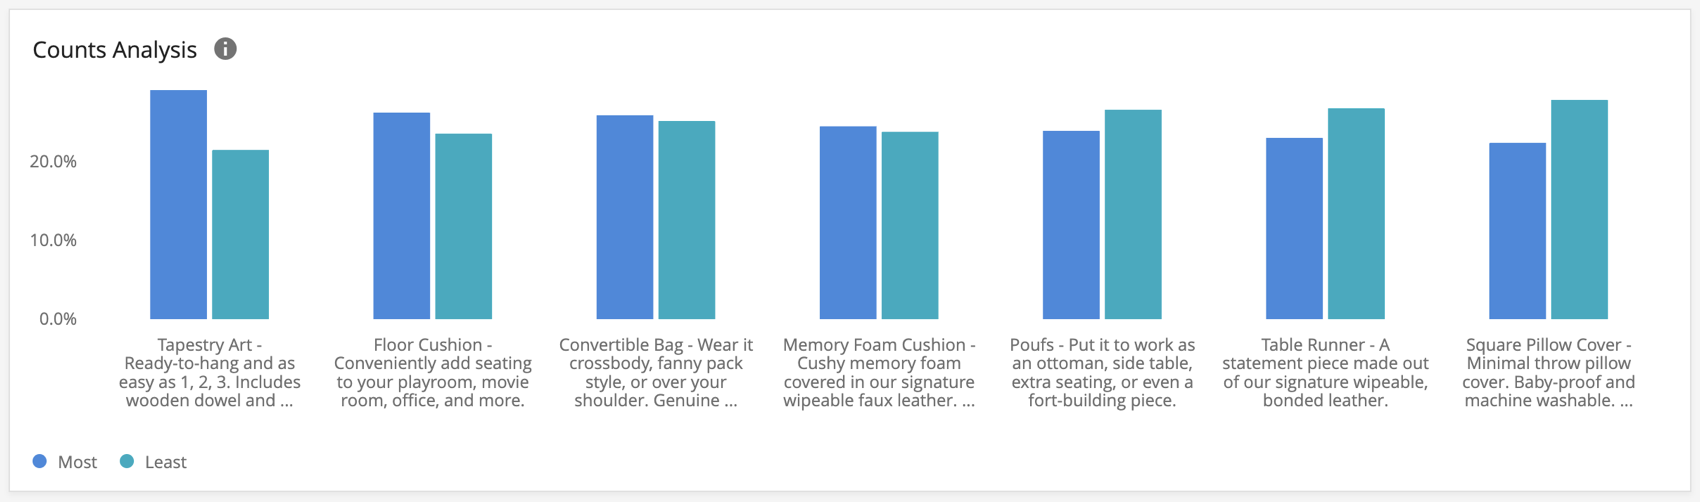
- Count Analysis: Represents the percentage of times the idea was selected Most / Least preferred when it was shown.
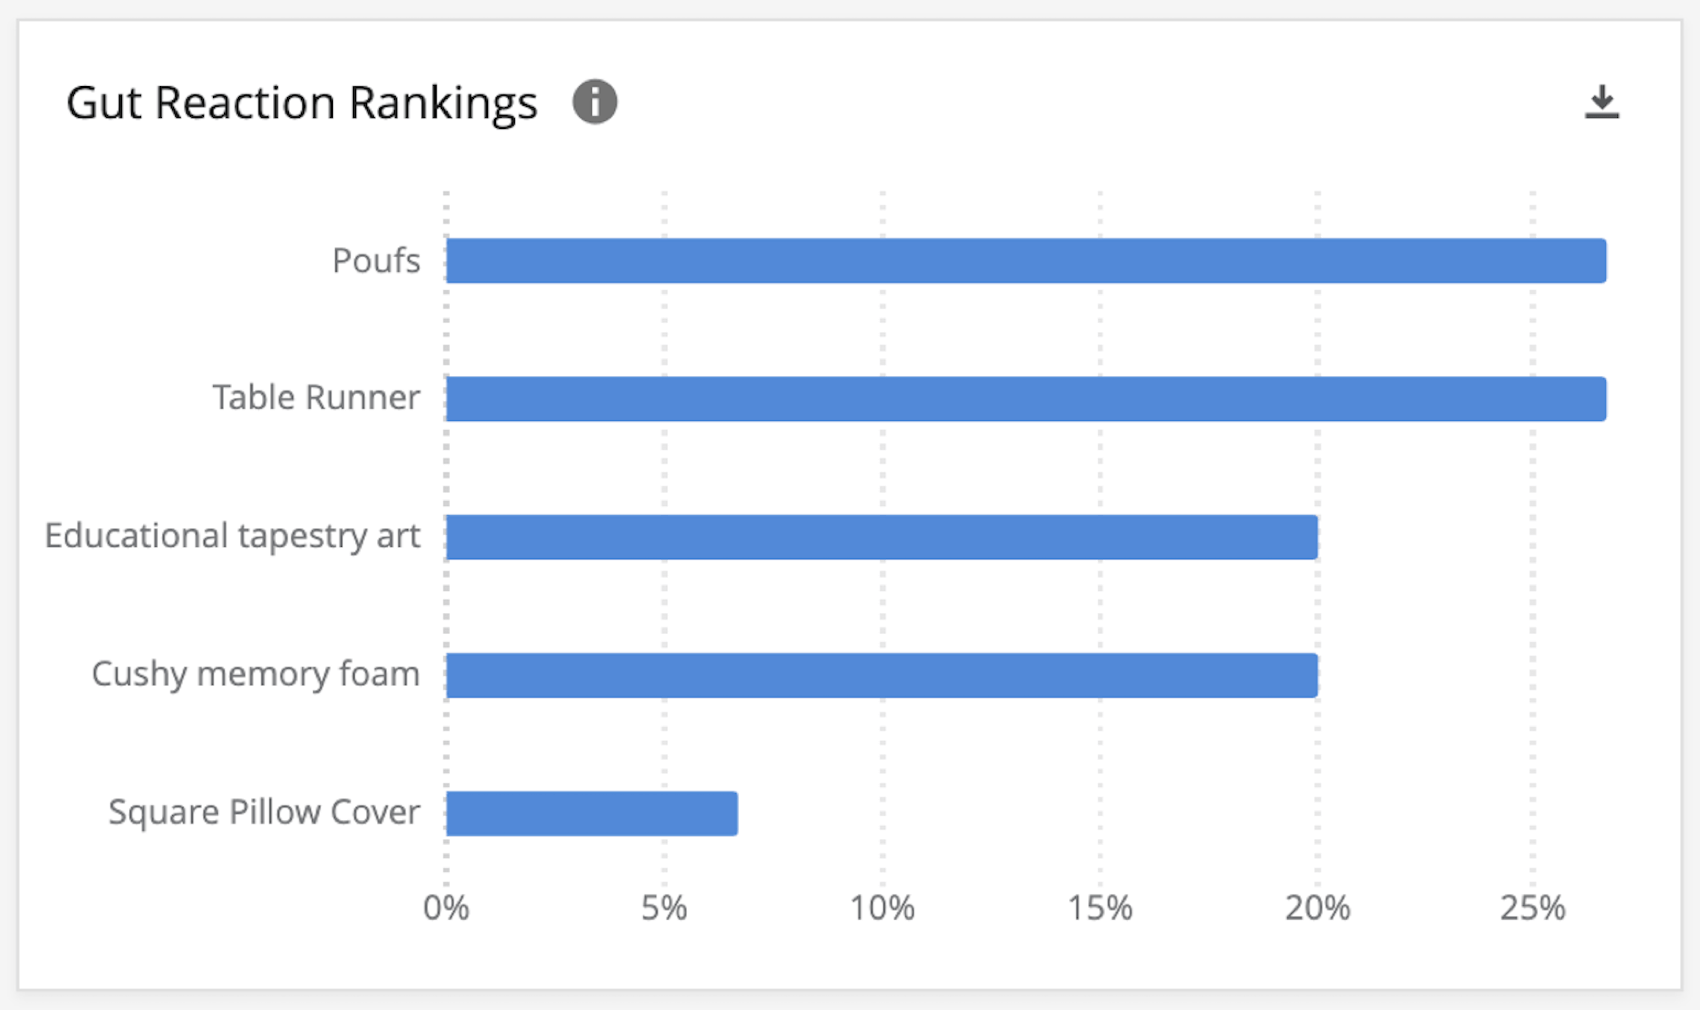
- Gut Reaction: Measure the initial reaction to a product idea. A larger percentage indicates that respondents “liked it a lot” or “liked it a little” in their initial reactions.
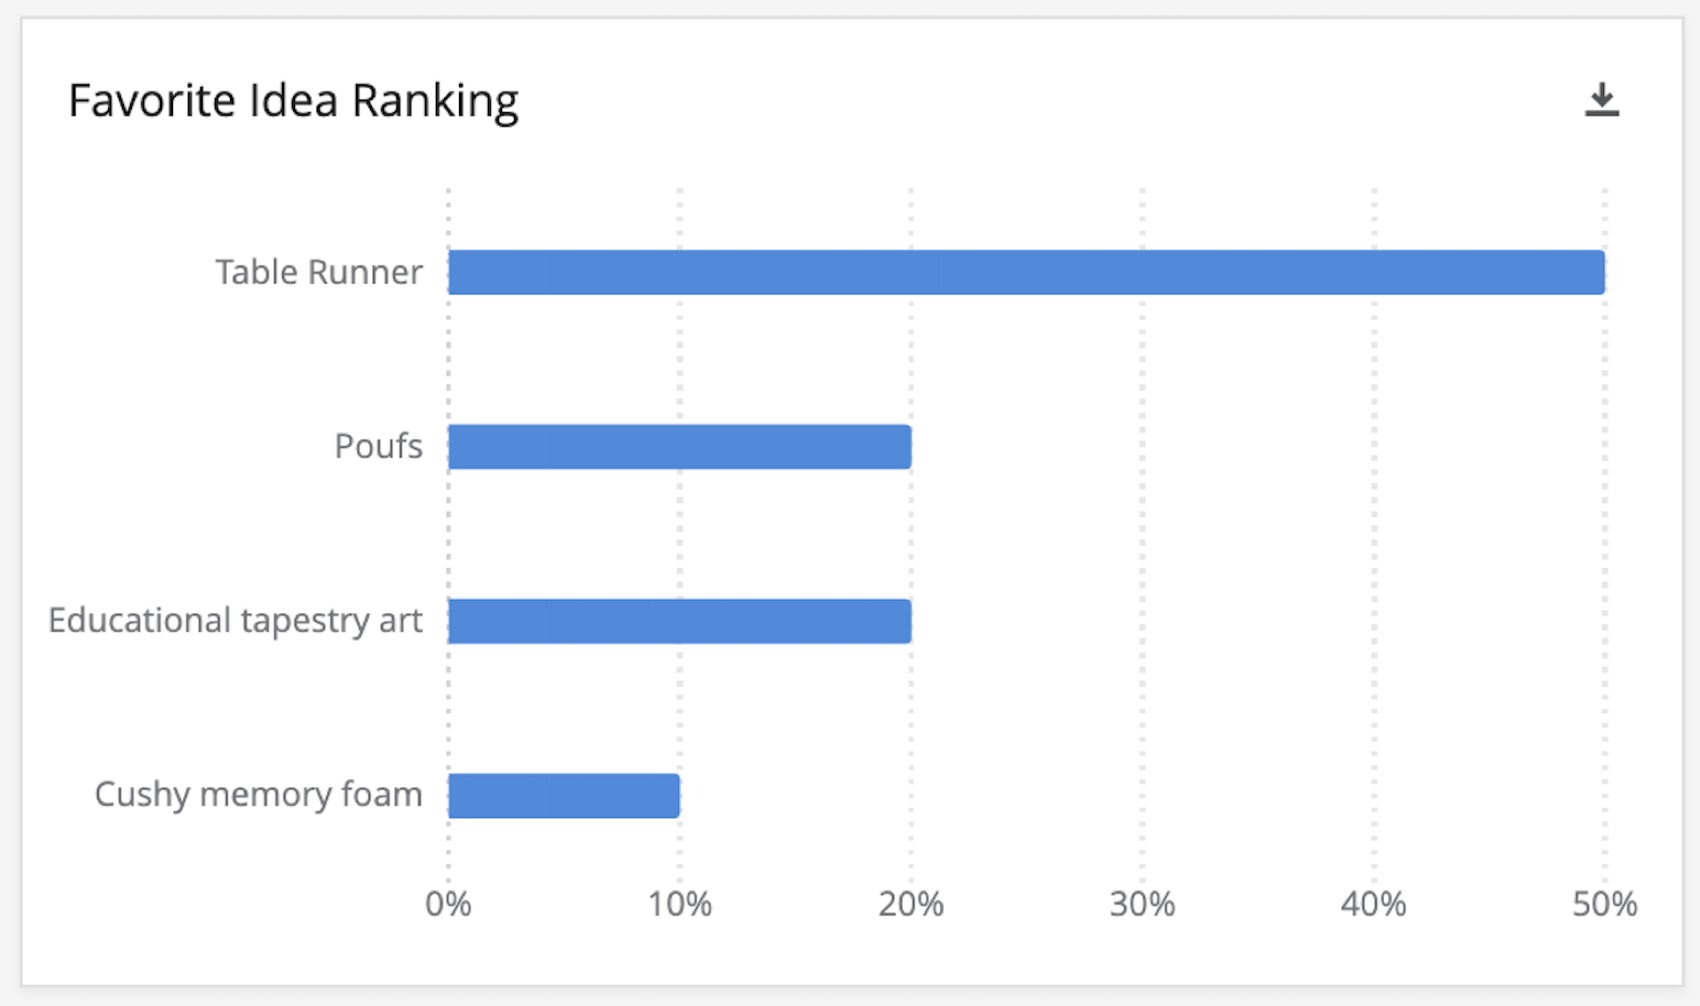
- Favorite Idea Ranking: Ranks ideas according to the percentage of respondents who marked it as their favorite out of the group of ideas.
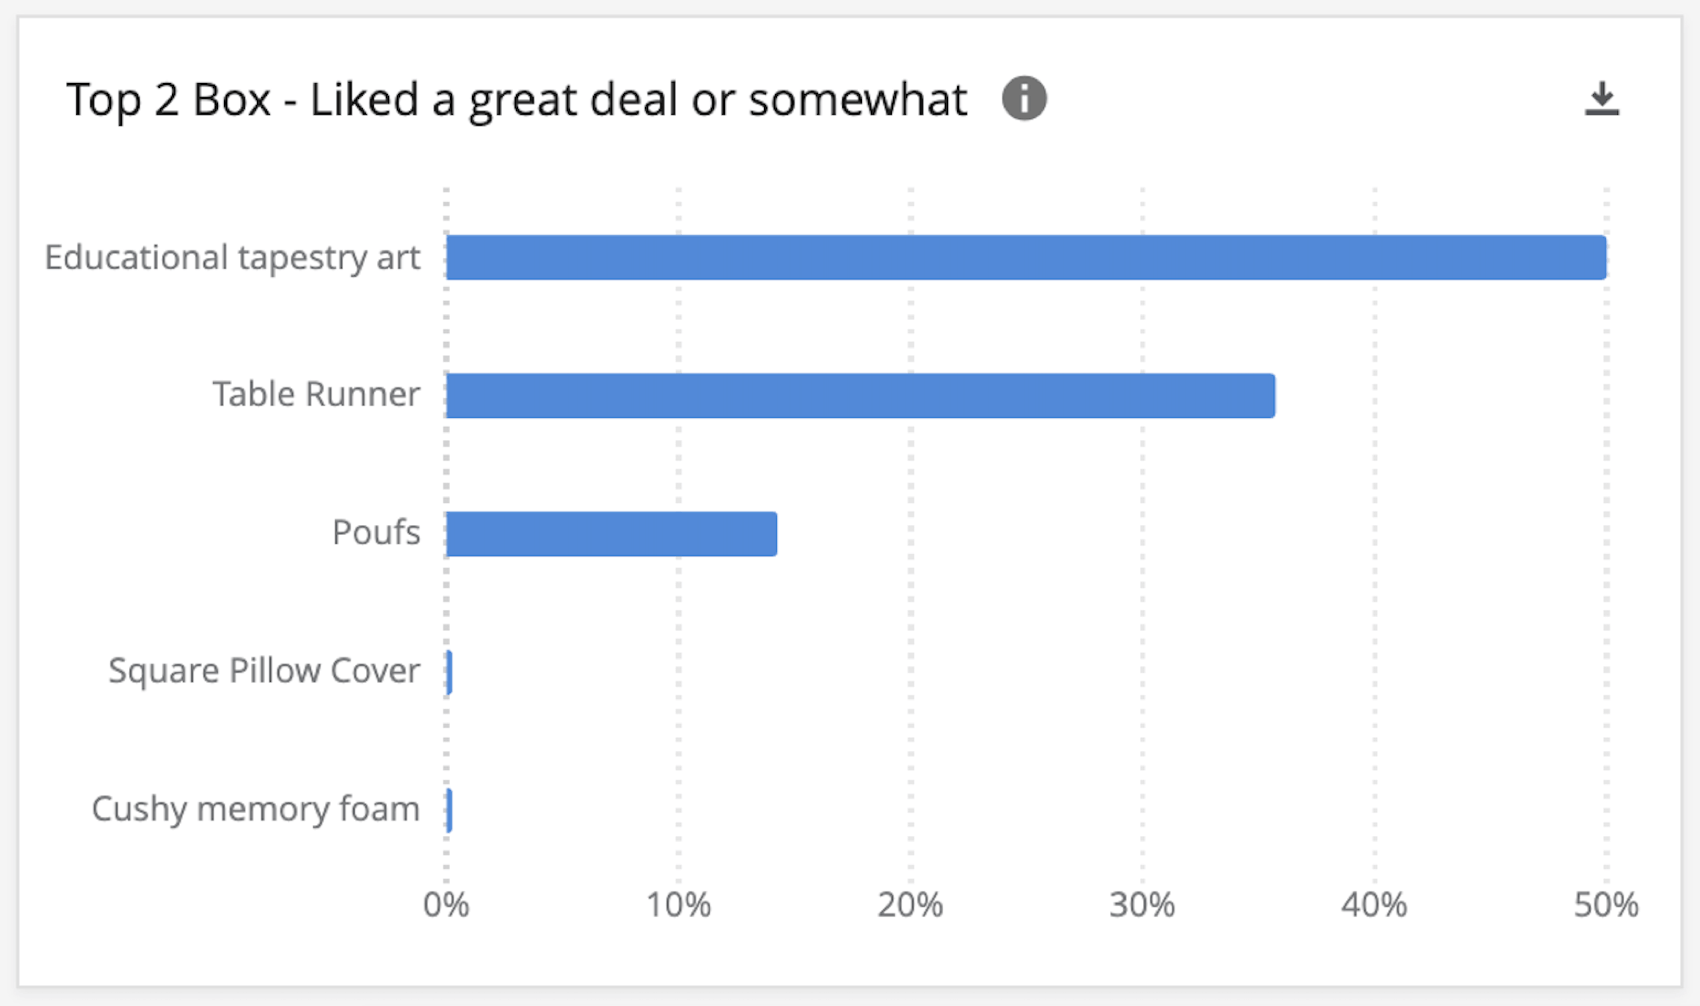
- Top 2 Box – Liked a great deal or somewhat: Measures the approval of a given idea. A larger percentage indicates that respondents “Liked it a great deal” or “Liked it somewhat” in their overall approval.
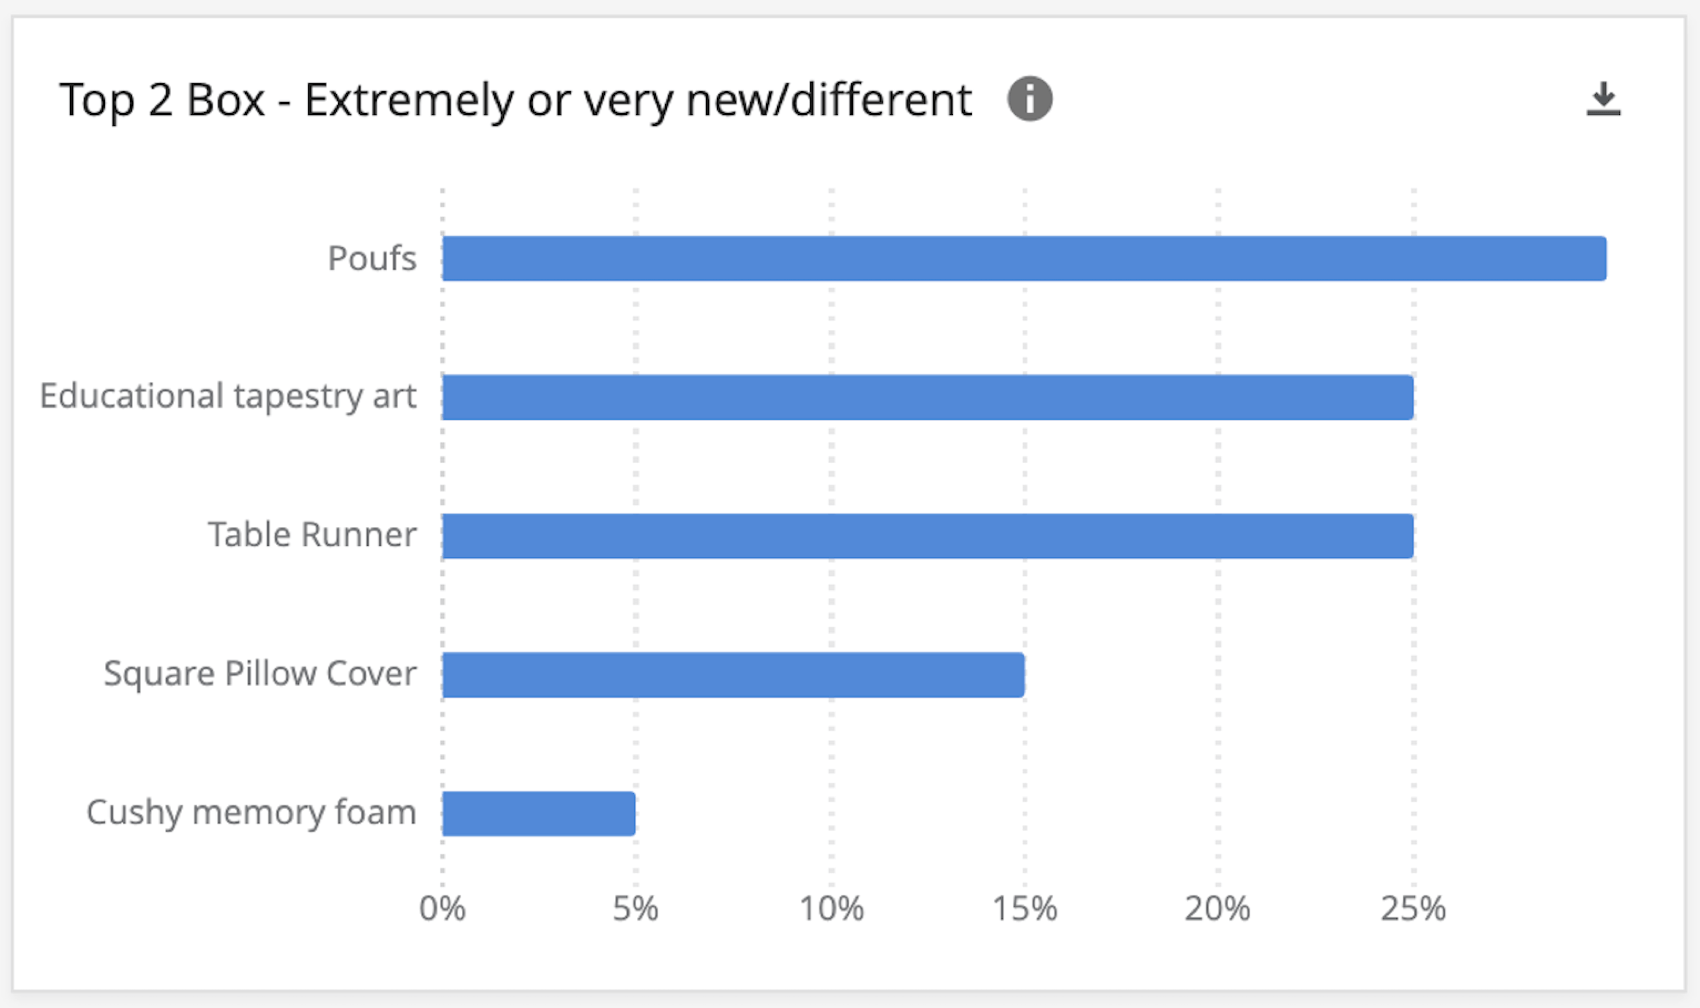
- Top 2 Box – Extremely or very new/different: Measures the uniqueness of a given idea. A larger percentage indicates that respondents found the idea “Extremely” or “Very” new or different.
Idea Breakdown
The Idea Breakdown page of the dashboard includes detailed breakdowns of your data. It has widgets that will show you the gut reaction, like/dislike, new/different, and favorite percentage breakdown for each idea.
Dashboard Editing
Check out these introductory pages to get started.
- Getting Started with CX Dashboards
- Step 1: Creating Your Project & Adding a Dashboard
- Step 2: Mapping a Dashboard Data Source
- Step 3: Planning Your Dashboard Design
- Step 4: Building Your Dashboard
- Step 5: Additional Dashboard Customization
- Step 6: Sharing & Administering Users