
Step 4: Reporting on Your Employee Engagement Project Results
What's on this page
You’ve set up your survey, participants, messages, and maybe even collected some responses. Now it’s time to start getting some insights from the data.
This is an extremely important part of your project. It’s not enough to just measure engagement; you need to understand what drives engagement. Ideally, you’ll also be able to determine which internal functions have control over potential drivers of engagement.
A reasonable outcome for an Employee Engagement project should be to identify at least one area for improvement at each level of the organization. Action items can be the same between different units. Remember that the aim is quality of actionable insights, not the quantity.
In this section, we’ll be showing you how to analyze your data in a number of ways to find areas for improvement or action planning.
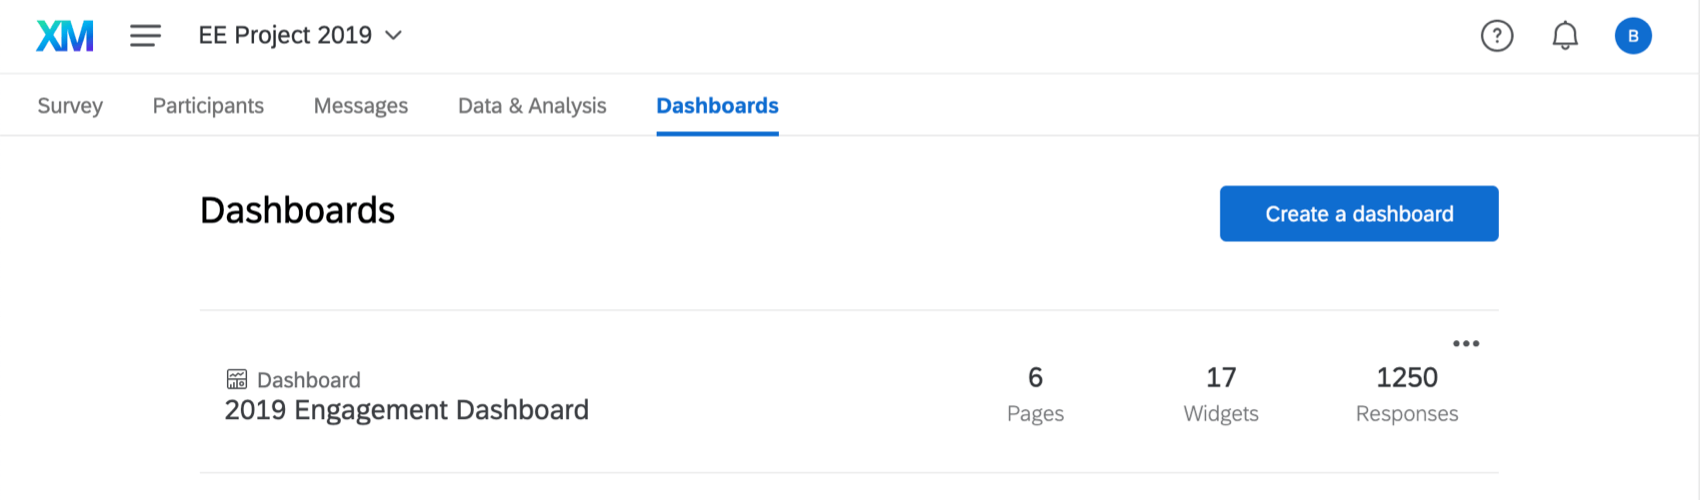
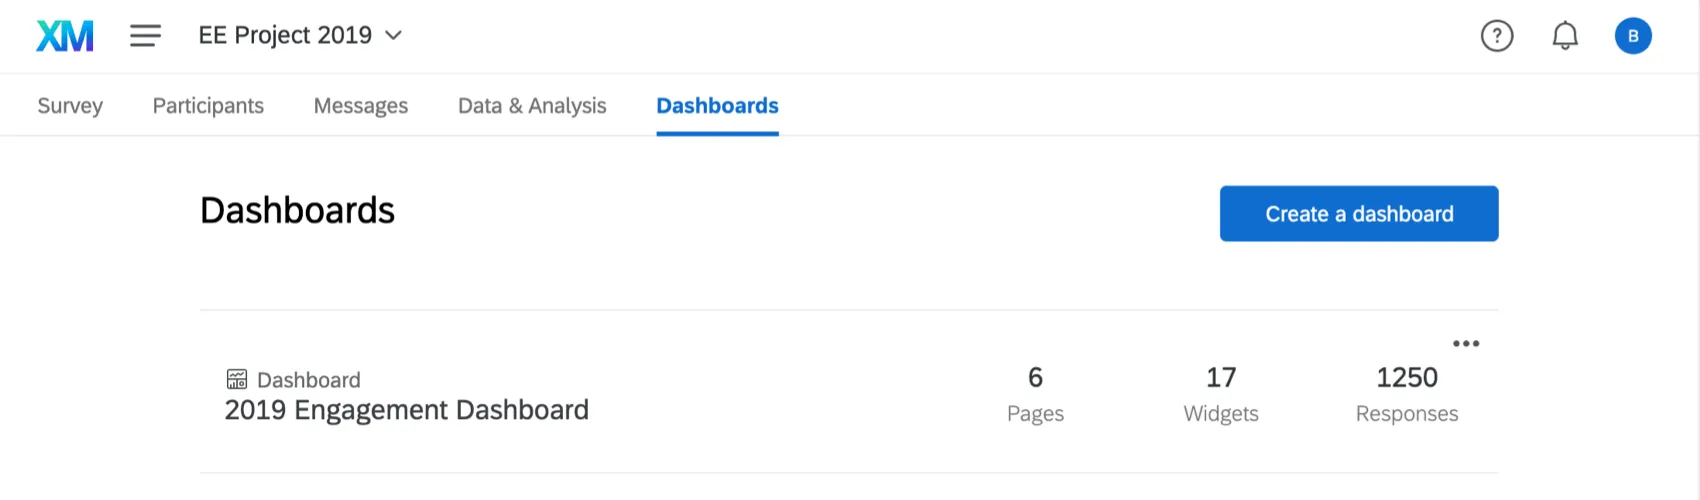
Setting Up Your Dashboard
Qtip: Check out the guided flow for help building a dashboard.
Before we start visualizing the data, we’ll need to review some general dashboard setup.
Anonymity Thresholds
The number you set for your anonymity threshold determines how many responses have to be collected before data is shown in the dashboard; before that, all data will be hidden. (The comments anonymity threshold is the same thing, but specifically for open-ended feedback.)
The reason we hide data this way is simple: we want to protect our employees’ identity early on in the data collection process. If Barnaby just finished his survey and Barnaby’s manager sees in his dashboard that only two members of his team responded, it’ll be very easy for the manager to guess which response came from Barnaby. However, anonymity thresholds prevent that kind of guesswork.
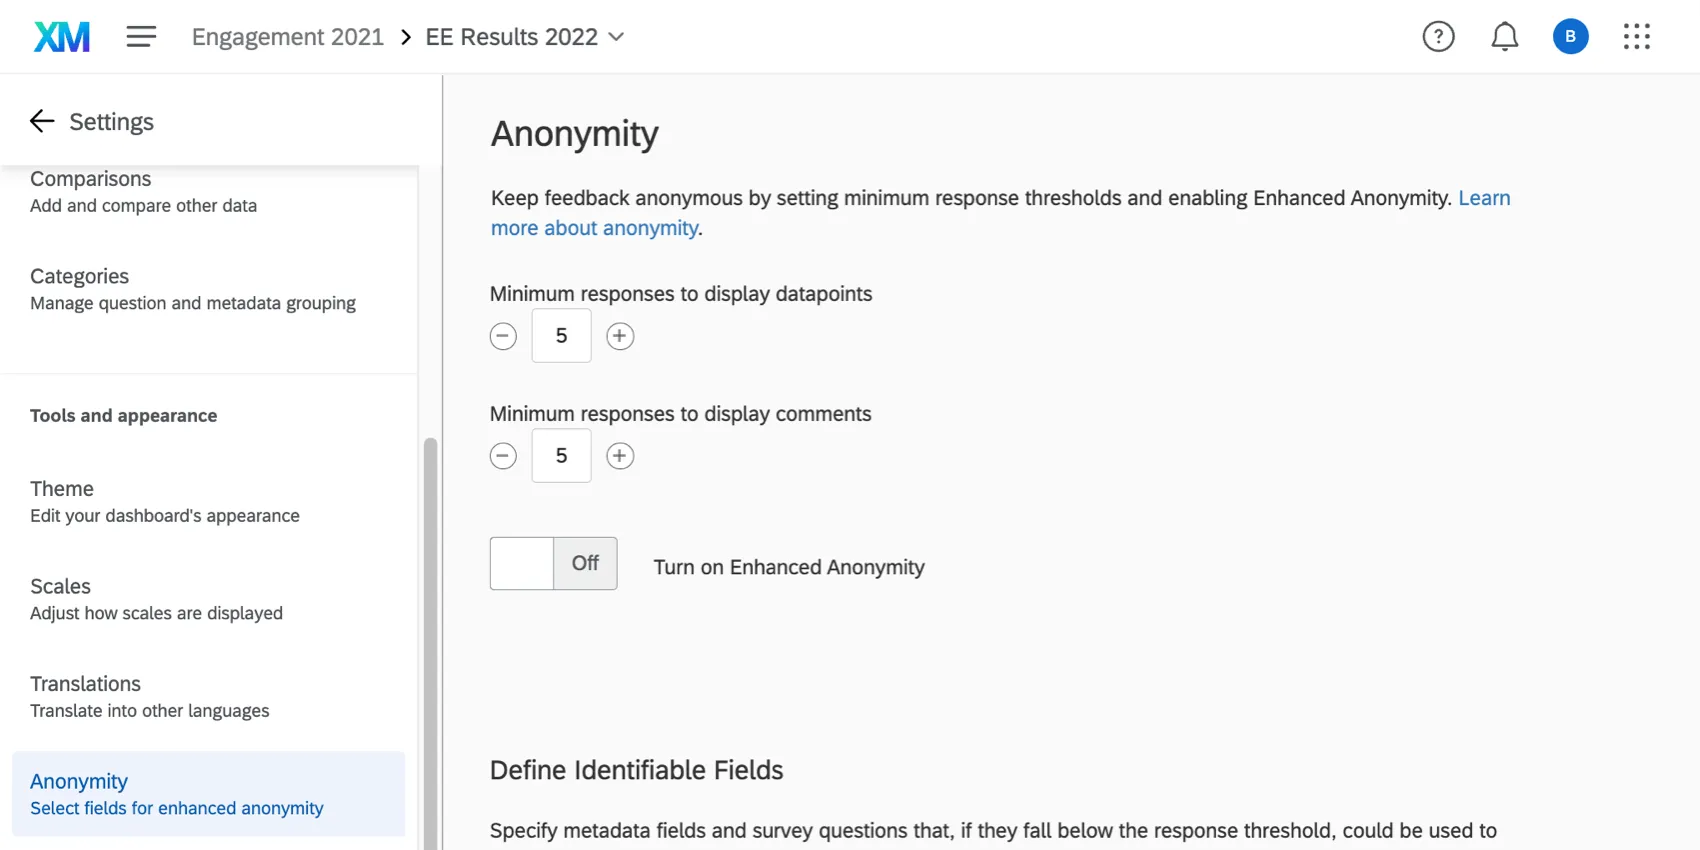
By default, you start with both an anonymity threshold and comments anonymity threshold of 5.
You can also decide if you want to enable enhanced anonymity.
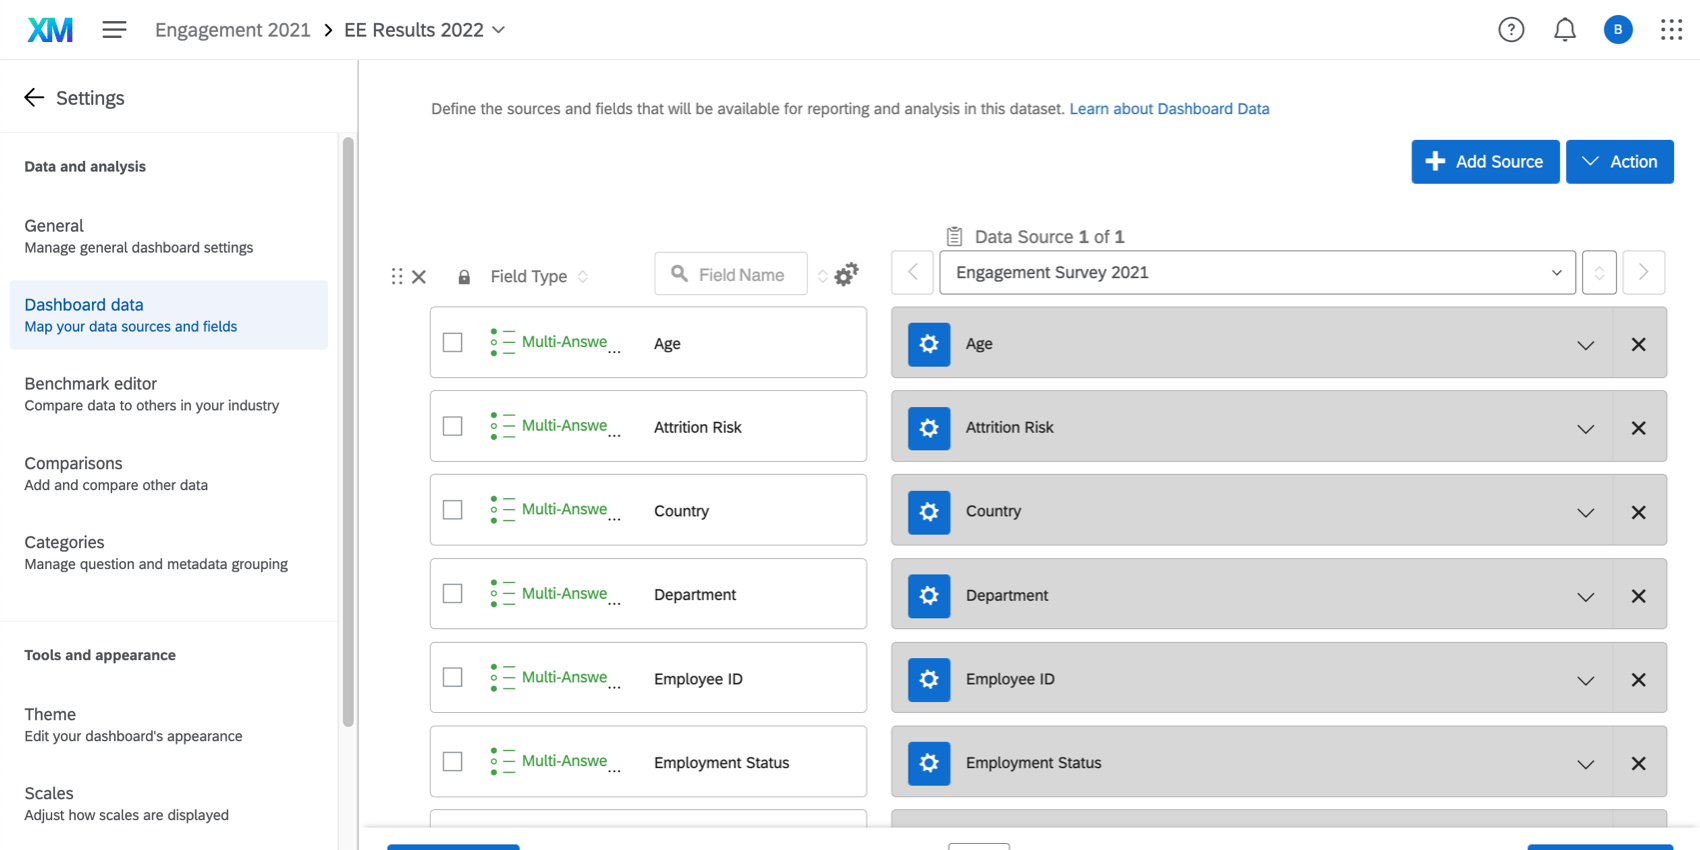
Using the Dashboard Data
Dashboard Data (once called the project mapper) is a powerful section of the dashboard settings that allows you to customize field names, change field types, or mark fields as sensitive. Whenever making changes in this section, don’t forget to select Save in the bottom-right hand corner of your screen.

Field Name: You can rename a metadata field or question by simply revising the field name in the box and typing a new name. Note that you are only renaming the field in this dashboard, not in other dashboards, the survey questions, or participants information.
Field Type: Fields are generated by Qualtrics automatically and will likely not require any adjustments. You can, however, change the field type to change the way a question or metadata field is available for use in widgets. Use the table below to help you determine if you need to change the field type for a question or metadata field.
Recommended Field Types for Employee Engagement:
| Field Type | Data Format | Recommended Widgets |
|---|---|---|
| Number Set | A range of numeric values, used with scaled questions | Question lists, scorecards, comparisons, heat maps, engagement summaries, simple charts, simple tables |
| Date | A date, such as survey start date or end date | Page level filters and filtering within widgets |
| Multiple Answer Text Set | A range of text values, such as those from a metadata field or from a multi-select multiple choice question | Dashboard filters, simple charts, simple tables |
| Open Text | Text comments longer than a few words | Word clouds, response tickers |
Recoding Field Values: When you create a dashboard, metadata labels and numeric values associated with questions are brought over automatically. If you need to change the name of a value within a field, you can recode that value. Click on the cog wheel icon to change recode values.
Qtip: If you’d like more than one engagement project to be used as your dashboard’s source, such as historical project data, see Adding Additional Sources.
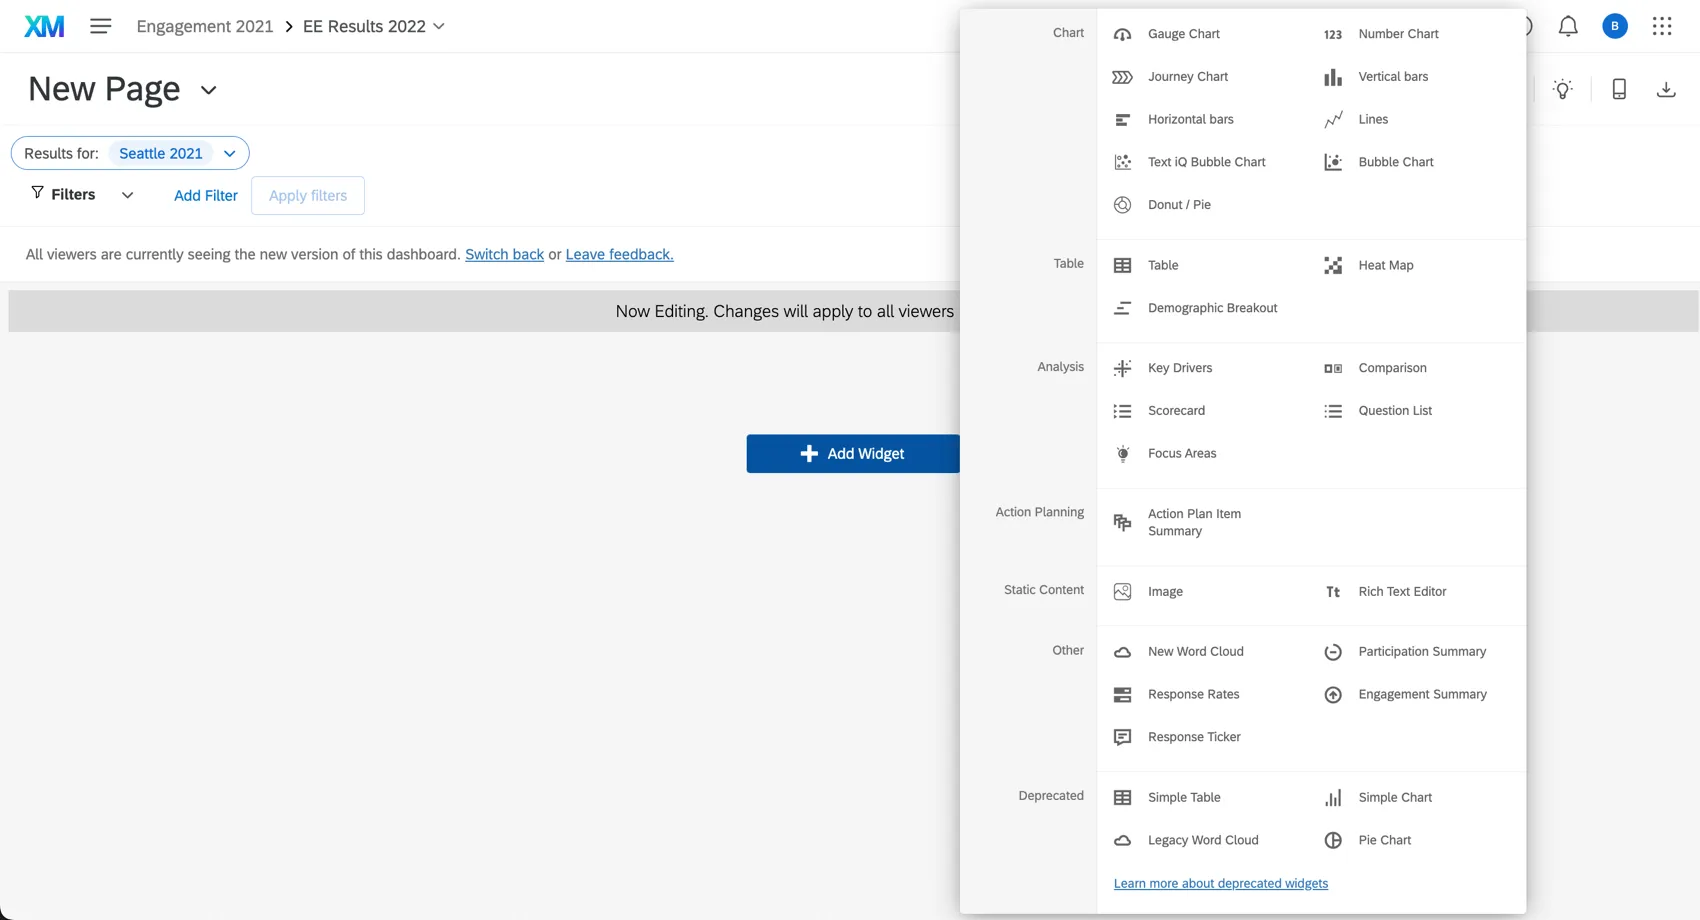
Creating and Customizing Widgets
Now that you’ve completed the initial dashboard setup, it’s time to visualize the data.
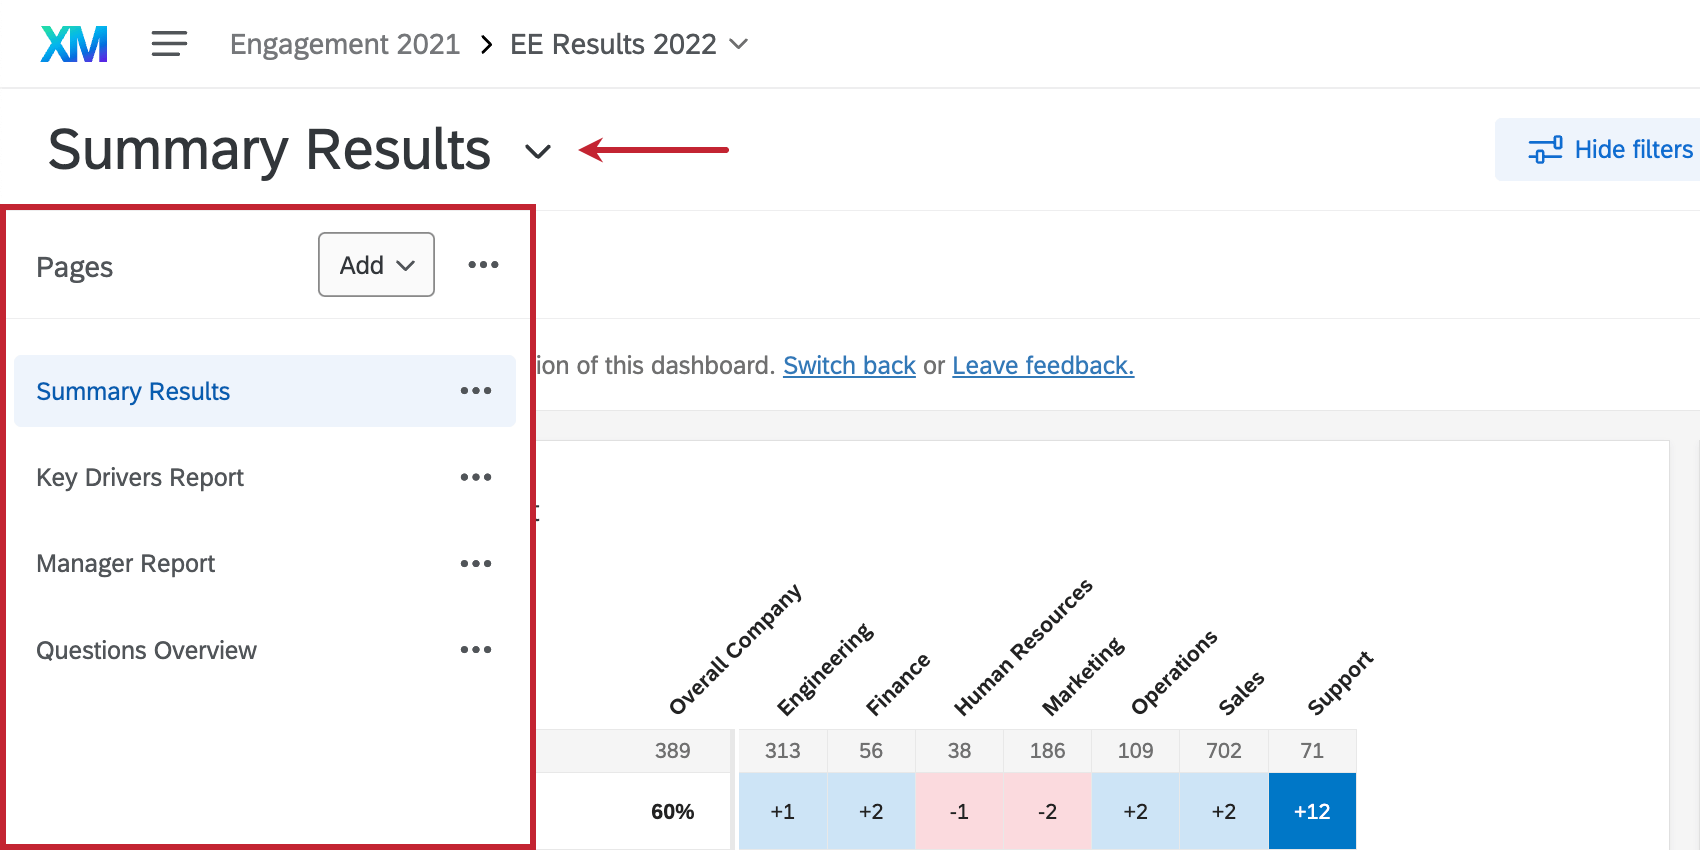
Planning Dashboard Pages

A dashboard is made of pages, and each page contains widgets. For a clean design, there should be a purpose for each page. When designing each page, think about how this page will help a dashboard user understand their data in the easiest way. Typically dashboard pages start with summary information at the top, getting more detailed the further down you scroll. Do not include too many pages in a dashboard, or too many widgets on a page, or your dashboard users could become overwhelmed.
To help you get started planning what kinds of pages you want to include in your dashboard, try filling out a table like the one below.
| Page Name | Objective | Who Will Access | Widgets |
|---|---|---|---|
| Engagement Summary | A quick glance of engagement score and highest / lowest items | All managers | -Engagement summary widget -Question list widget -Key drivers widget |
| Participation | Show a manager the breakdown of response rates and participating demographics | All managers | -Participation summary widget -Response rate widget |
| Comparisons & Breakouts | Allow managers to compare different groups’ responses to certain questions | Directors Only | -Comparison widget -Heat map widget -Demographic breakout widget |
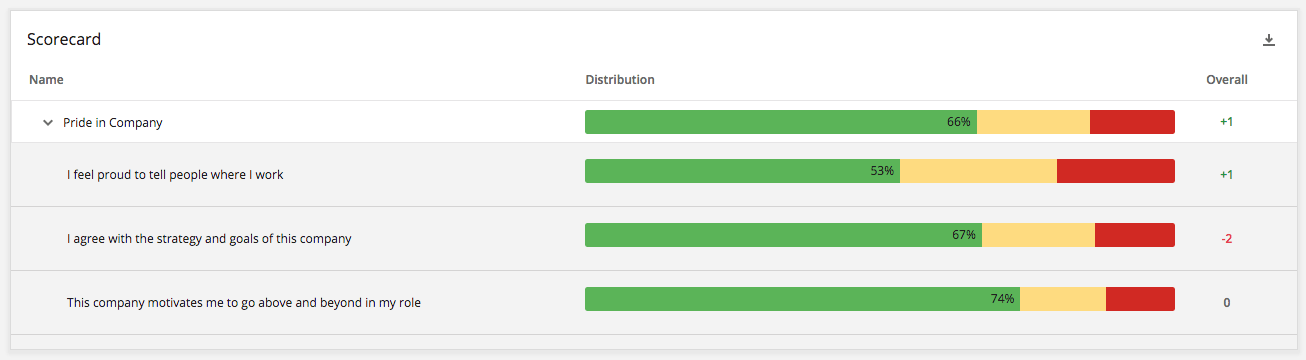
Employee Engagement Widgets
Check out the Widgets Overview support page to learn more.
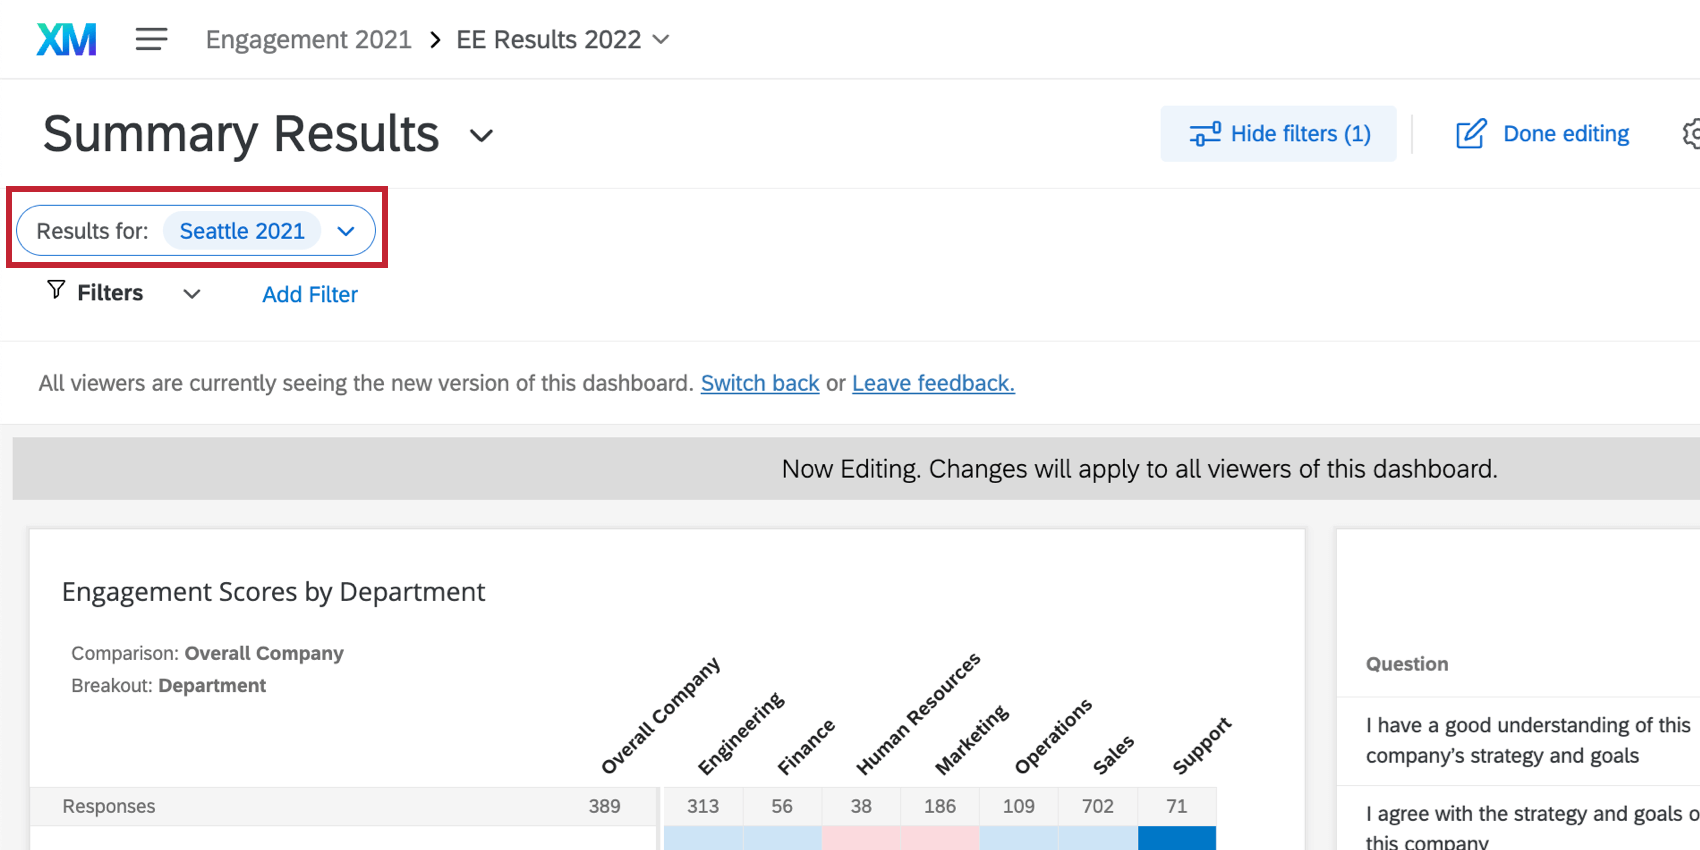
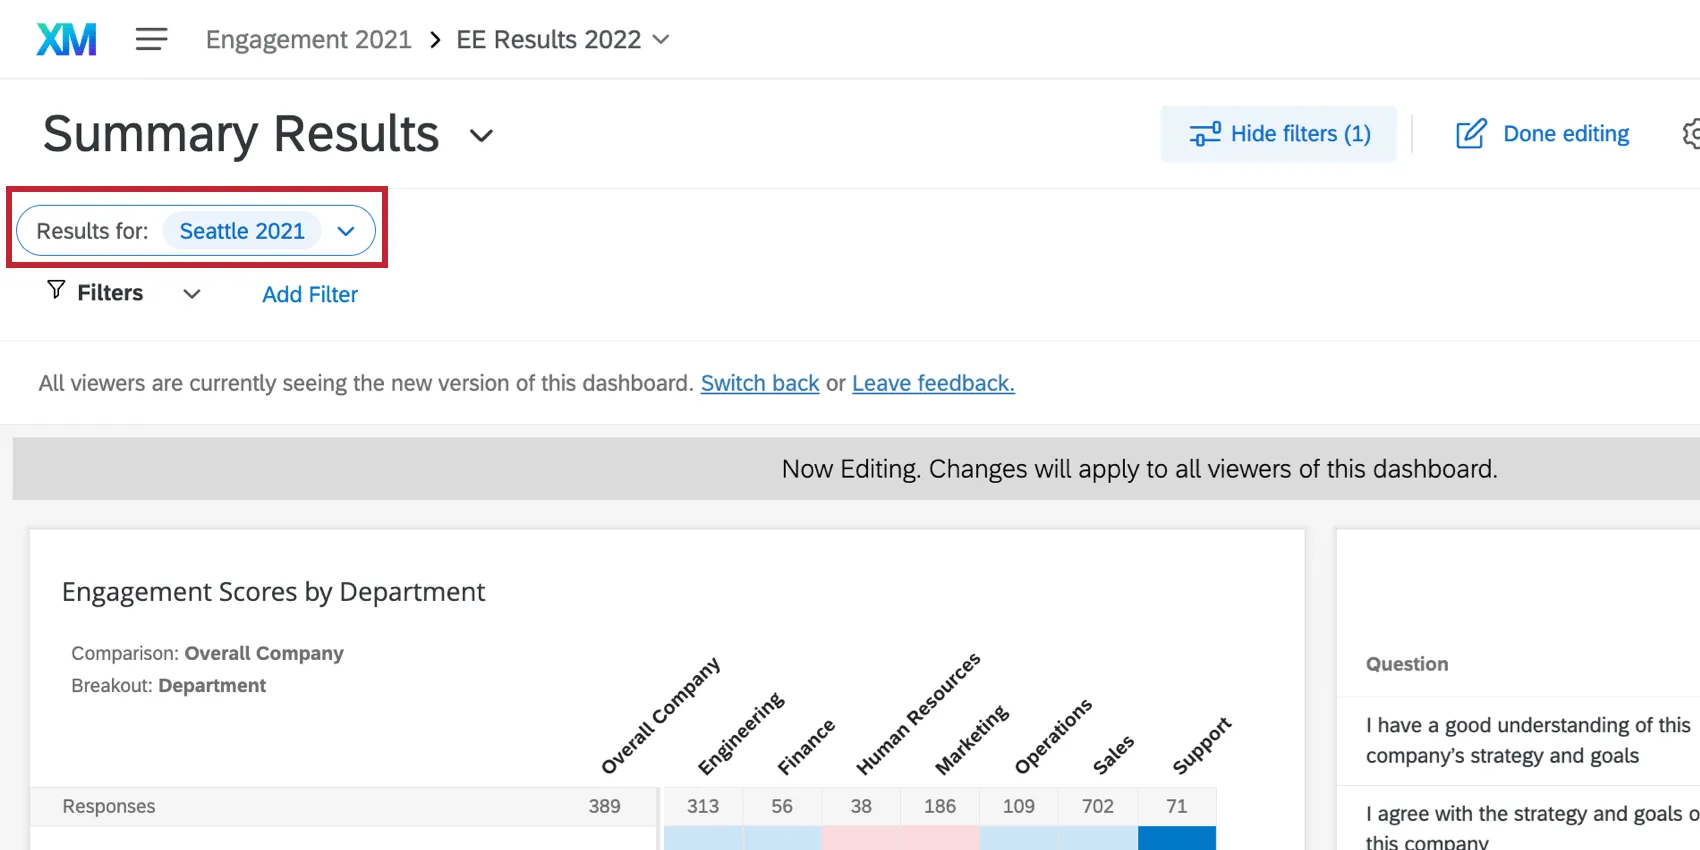
Filters and Comparisons
Filters allow your dashboard users to narrow down the dashboard only to data that is relevant to them. The dashboard typically includes the hierarchy as the primary filter; this allows managers to quickly toggle through units they are responsible for and see results for the different areas of their business.
Subsequent to this, page-level filters can be set up to breakdown results for different segments of employees. These filters can come from precoded information or from questions. Typical examples include tenure, employment status, gender, and age. See Filtering Dashboards by Questions, Embedded Data, and Metadata for more details.
Qtip: We recommend keeping all tenure/age comparisons in range brackets (e.g., not a person’s exact age, but a bracket, like 24-35) because start date or date of birth can have infinite values, and will leave you with long lists in reporting that are difficult to analyze and draw conclusions from.
Adding comparisons to certain widgets can also help users compare their performance with internal benchmarks such as the previous year’s performance, or the overall company’s performance. See the Comparisons support page for instructions on how to set these up, and what widgets are compatible.

Configuring Dashboard Access
After building your dashboard, it’s time to determine who gets access to the data and what level of access they should have. To accomplish this, you’ll need to learn about dashboard roles, permissions, and messages.
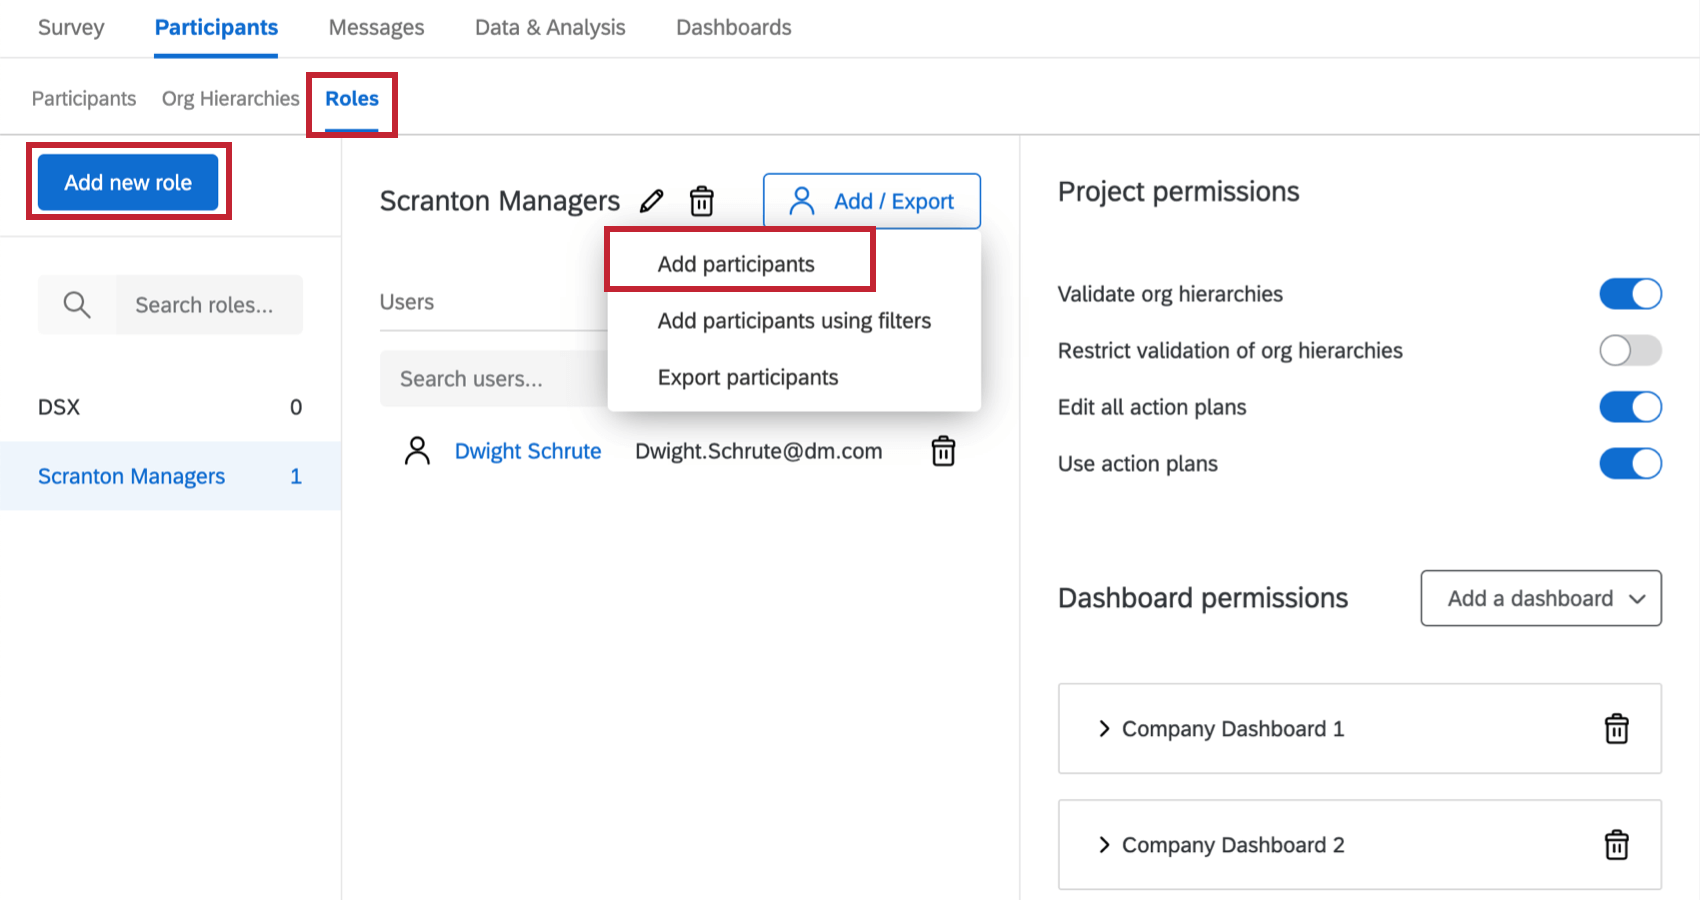
Dashboard Roles
A role is a group of dashboard users that allows you to easily allocate permissions all at once. Typically projects will include a primary role that encapsulates all of the organization’s managers. This is done by creating a role and adding all the managers in the organizational hierarchy to this role. For additional information, visit the Roles support page.

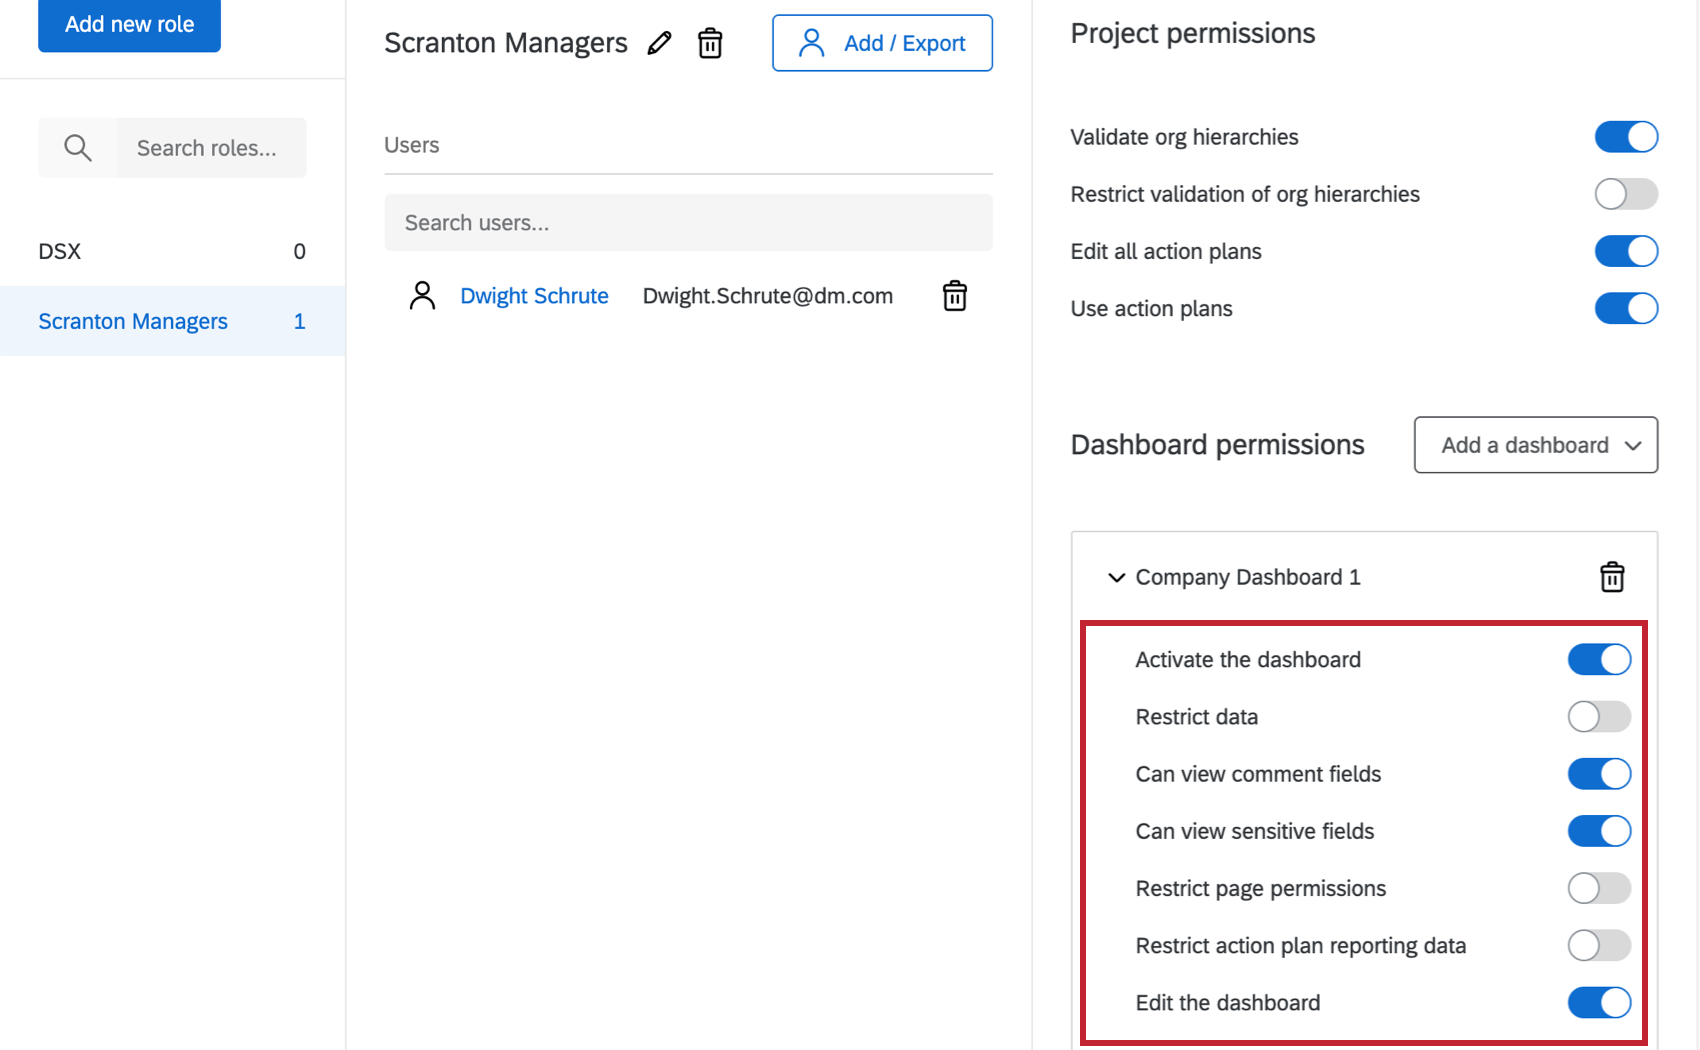
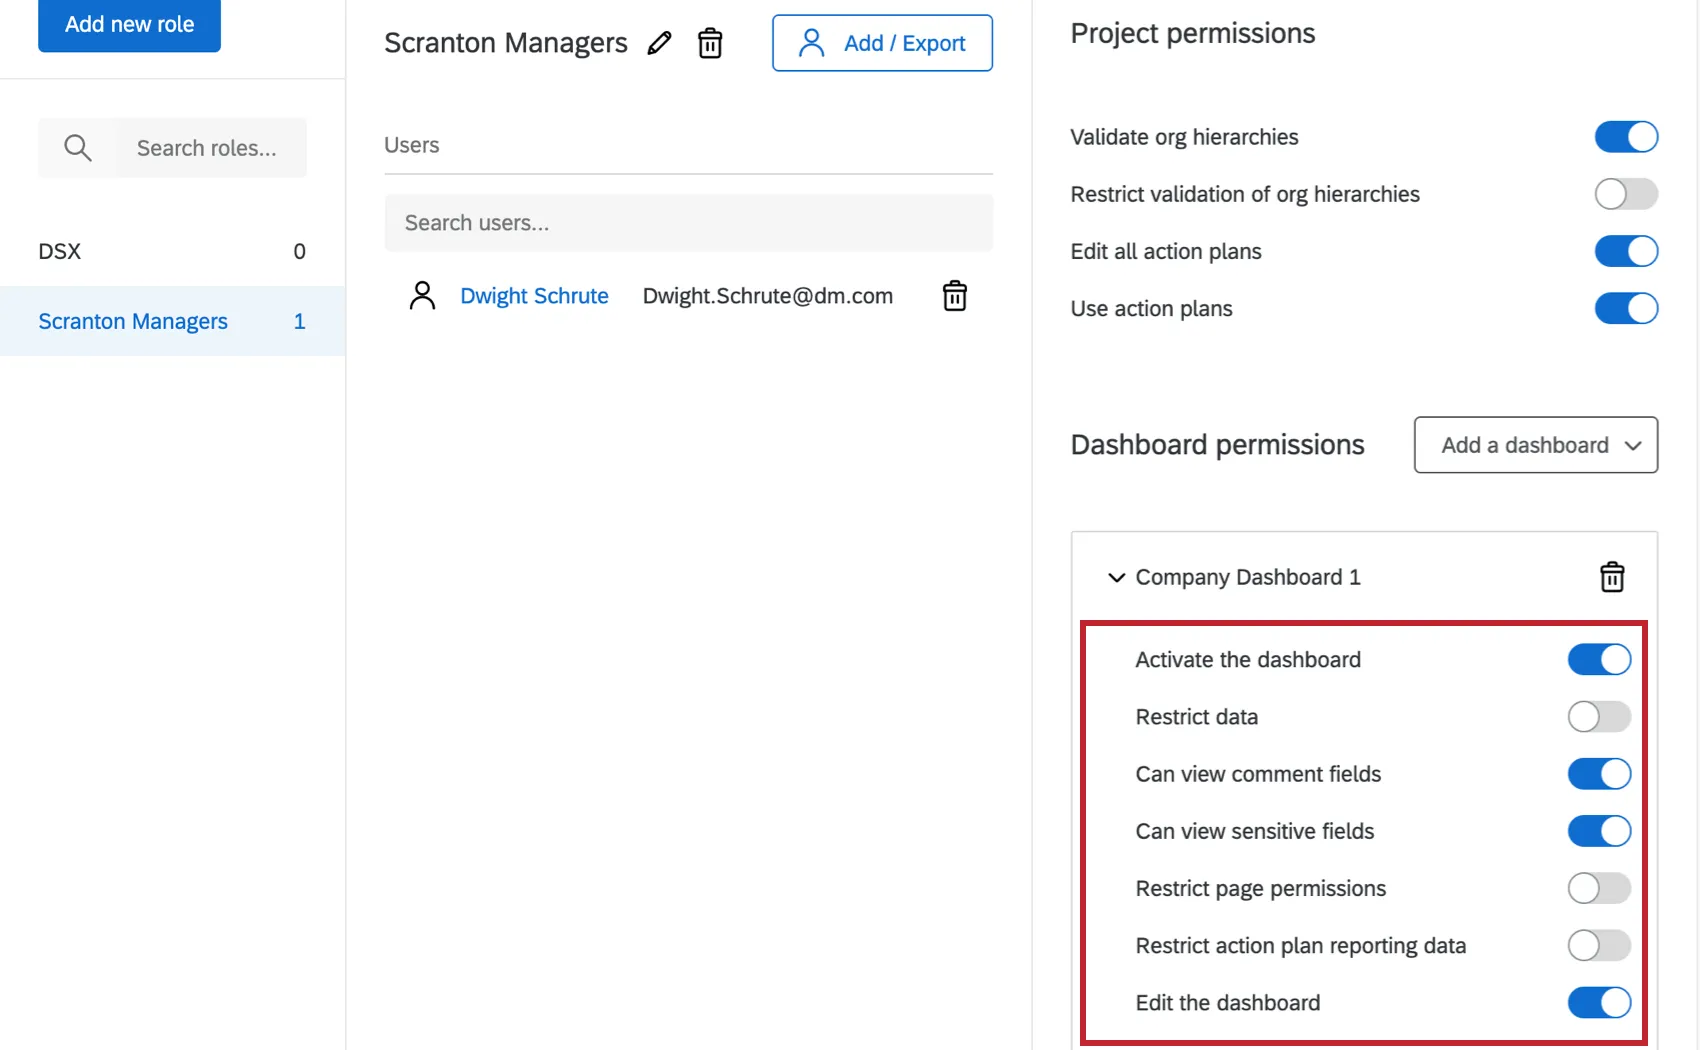
Dashboard Permissions
On the right side of the screen, you can find the list of available dashboard permissions. Switch specific permissions ON or OFF and they will apply to all users within the role. For additional information, visit the Permissions section of the Participant Information Window support page.
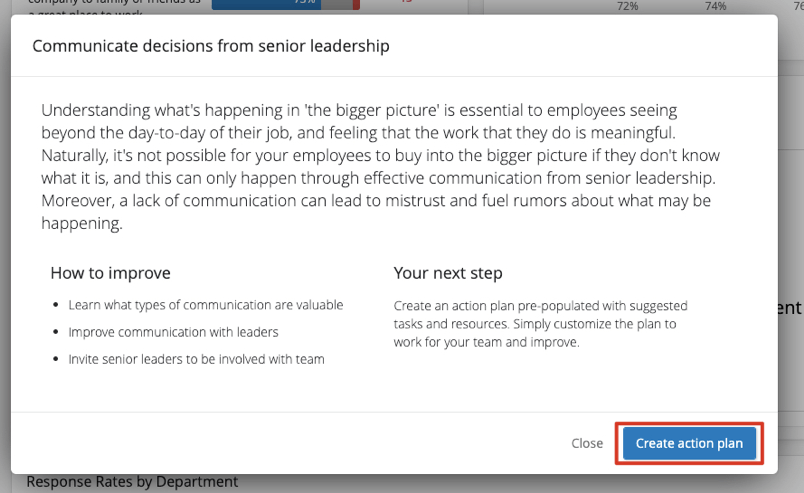
Action Planning
Action Planning allows you to close the loop with employee feedback, giving every leader and manager the power to drive impact in areas employees care about most. Admins can even give managers best practice guidance and recommended actions specific to each focus area so they can create action plans. Furthermore, you can embed your own culture-specific content to associate with each recommended action.

Action planning comes with its own sets of Permissions. See Guided Action Planning to learn how you can set up action plan guidance and for instructions on creating the action plans themselves. Reporting on Action Plans can help you learn how to build dashboard pages that illuminate your action plans’ results.
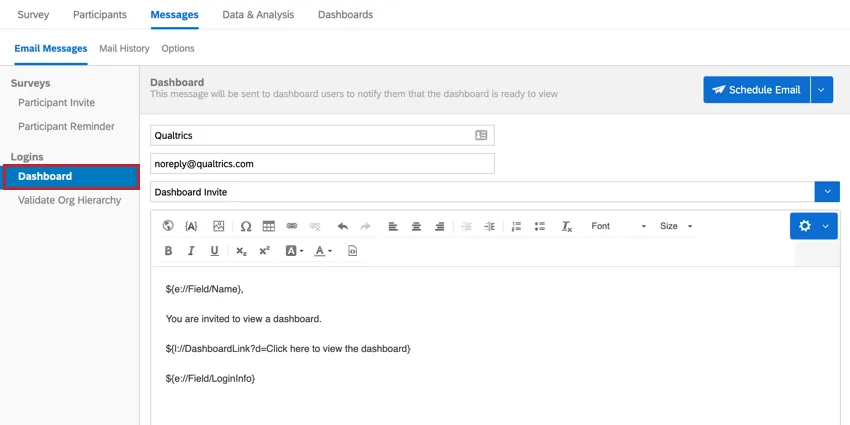
Dashboard Messages
In the Messages section, you’ll find the Dashboard Login invitation message type. This message can only be sent to people who have the “Activate Dashboard” permission turned ON. If you’re trying to send the Dashboard Login message and you don’t see any or too few recipients for the message, check your roles to ensure that the “Activate Dashboard” permission is turned ON.
Steps for Giving Dashboard Access
For more on building dashboard messages, see Dashboard Email Messages.
FAQs
How can I stay up to date on new Qualtrics features?
How can I stay up to date on new Qualtrics features?
To access these release notes, you need an XM Community account. These accounts are free for any users with a Qualtrics account. This support page contains information for how to register an XM Community account.
Once you're logged into the XM Community, head over to the Weekly Product Updates Introduction Post. This post contains all the information you need to get started with subscribing to product updates!
What are EX Dashboards?
What are EX Dashboards?
That's great! Thank you for your feedback!
Thank you for your feedback!