-

Qualtrics Platform -

Customer Journey Optimizer -

XM Discover -

Qualtrics Social Connect
Text iQ in Dashboards
About Text iQ in Dashboards
Sometimes a study calls for a dashboard that performs more extensive text analysis than a Word Cloud can provide. You may wish to label text responses by topic, or perform analysis on the sentiment (i.e. positive/negative slant) of a comment. With Text iQ in Dashboards, you can perform these analyses and display them in your widgets, just as you would with any other variable.
Text iQ can be used in CX Dashboards, brand dashboards, and pulse dashboards. It is not available in any other Employee Experience dashboards.
Navigating to Text iQ in Dashboards
There are 2 ways to find Text iQ in a dashboard. Regardless of which method you use, each will show the same text analyses you’ve conducted in the dashboard previously.
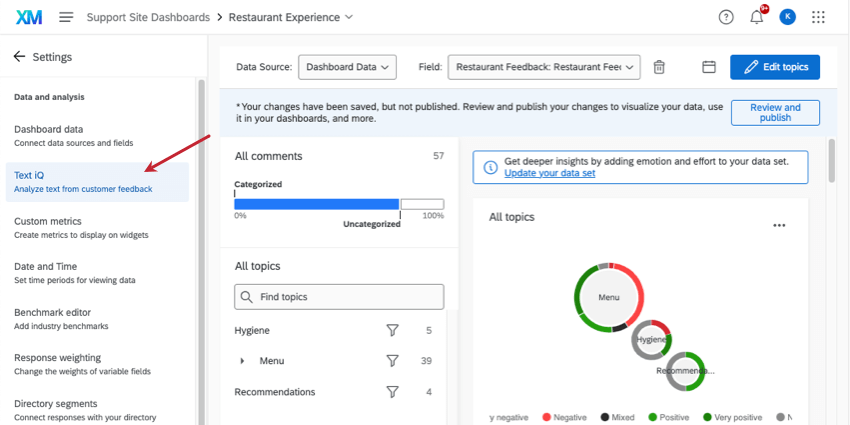
One option is to go to the settings page of your dashboard, and select the Text iQ tab.
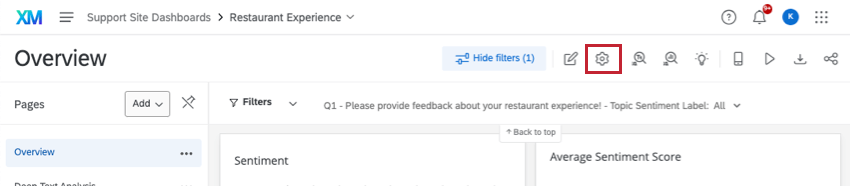
Another option is to click the Text iQ button at the top of the page.
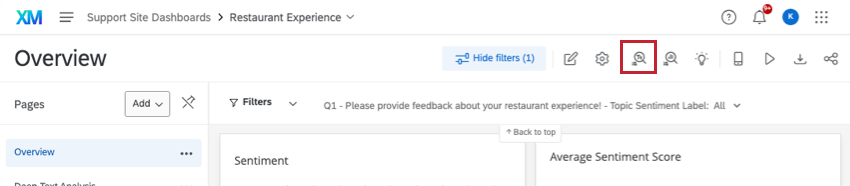
Qtip: There are a few situations where you won’t see this Text iQ button:
- If you have any data restrictions applied.
- If your organization doesn’t have Advanced Text iQ.
- If you’re only a participant in a Pulse dashboard.
- If you’re viewing the dashboard from the Dashboard Viewer.
Mapping Text Entry Questions
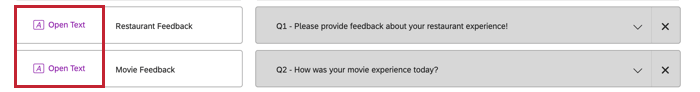
Before you start performing text analysis, you need to make sure your text entry questions are mapped correctly.
In your dashboard data, make sure you’ve set your text entry questions to Open Text.
If your dashboard has multiple sources mapped to it, it is okay to not have data mapped to the Open Text field for each of your sources.
Text Analysis Capabilities
Text iQ has the same capabilities in the Survey Platform as it does in dashboards. Below is a series of links to the Survey Platform pages, complete with step-by-step instructions.
- Text iQ Functionality: Navigating Text iQ, saving changes, and the spellcheck and lemmatization capabilities.
- Topics in Text iQ: How to create and manage Text iQ topics. Also includes how to build complex searches.
- Sentiment Analysis: How to edit and perform sentiment analysis.
- Widgets in Text iQ: How to read and manage the widgets that appear directly inside Text iQ. Note that these are not necessarily widgets that can be used in the dashboard’s pages.
Mapping Topics and Sentiments
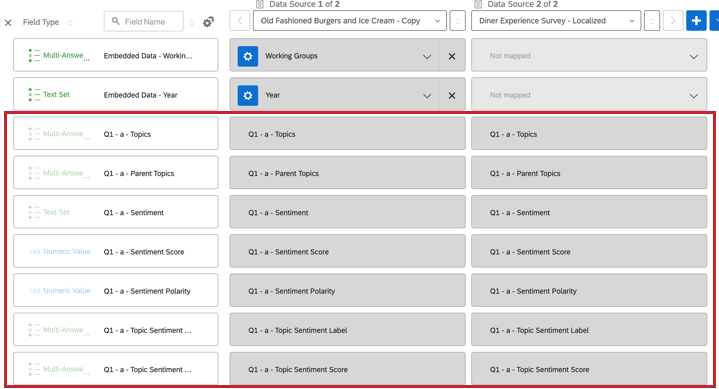
When you start performing text analysis in dashboards, the topics and sentiments will map onto your dashboard automatically and be assigned the best field type for their data. These fields include:
- Sentiment: This field will be populated with the overall response level sentiment label.
- Sentiment Score: This field will be populated with overall response level sentiment score.
- Sentiment Polarity: This field is no longer used and will eventually be deprecated.
- Topics: This field will be populated with all of the topics associated with a response.
- Parent Topics: This field will be populated with all of the parent topics associated with a response. If you are using hierarchical topics, this field is no longer needed in your dashboard.
- Topic Sentiment Label: This field will be populated with a sentiment label for each topic associated with your response.
- Topic Sentiment Score: This field will be populated with a sentiment score for each topic associated with your response.
- Topic Hierarchy Level Fields: If you are using hierarchical topics, there will be 5 fields corresponding to the topics at levels 1 through 5 (ex. Topic Hierarchy Level 3). Each field will contain a list of topics for that level.
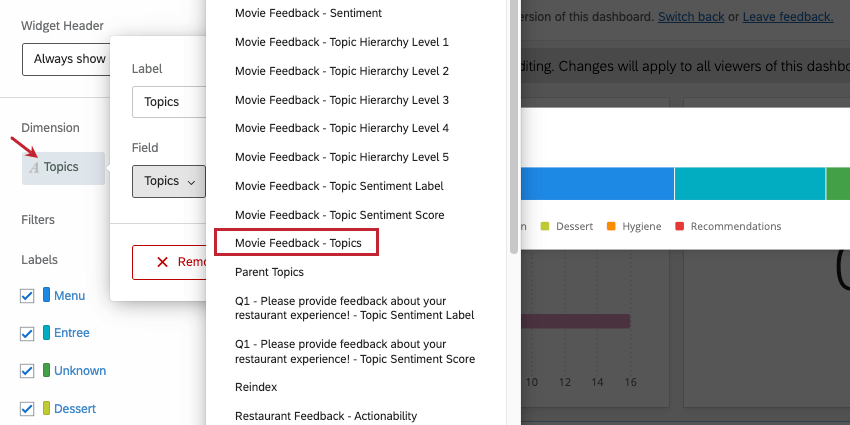
You can rename these fields as needed. You will not be able to delete them, change the field type, or change the mapping. By default, the field names include the name of the Open Text field being analyzed and the name of the specific text analytics. For example, “Movie Feedback – Sentiment.”
Adding Text Analysis to Widgets
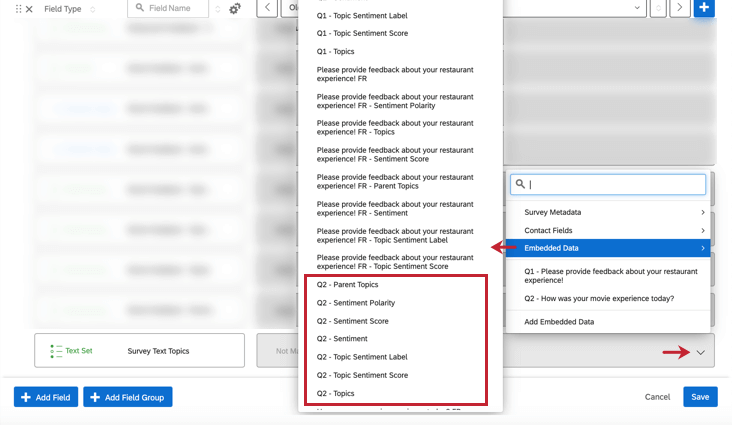
To add your text entry question’s topics or sentiments as a source, metric or dimension in a widget, look for the question text with “- Topics” or “- Sentiment” at the end.
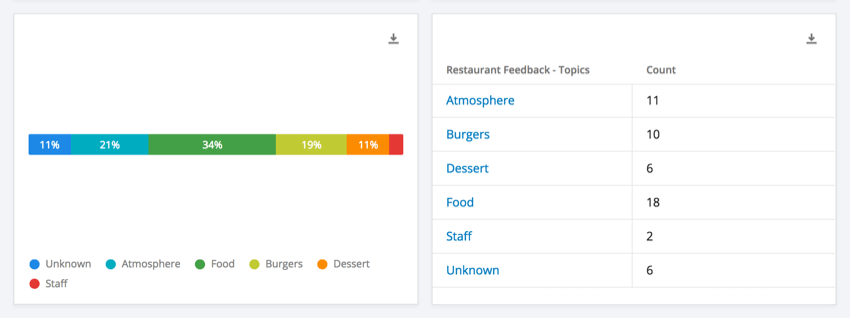
There are also widgets made especially for text analysis performed in CX Dashboards. See Text iQ Table Widget and Text iQ Bubble Chart Widget.