
Candidate Experience Program
What's on this page
About the Candidate Experience Program
The Employee Experience Candidate Experience Program allows you to continuously measure and act on candidate feedback across recruiting touchpoints by providing you with expert-designed and pre-built components. It’s best used for:
- Understanding the key stages of the talent acquisition process: the career site experience, application experience, screening experience, interview experience, and offer experience.
- Uncovering key experience gaps to better understand candidate behavior.
- Identify which recruiter actions or process changes drive a better candidate experience, reduce time to hire, and reduce cost per hire.
- Learning what attracts top talent to your organization and what they’re looking for in a new role.
This program consists of 4 pre-built surveys, 1 dashboard, and an optional Website / App Insights project.
Candidate Experience Programs leverage a specific combination of features and functionality, which we will walk you through below.
Qtip: Candidate Experience programs are typically conducted by the Qualtrics Implementations team or a third-party implementations partner. If you have questions about your implementation, please reach out to your Technical Success Manager.
Managing Your Program
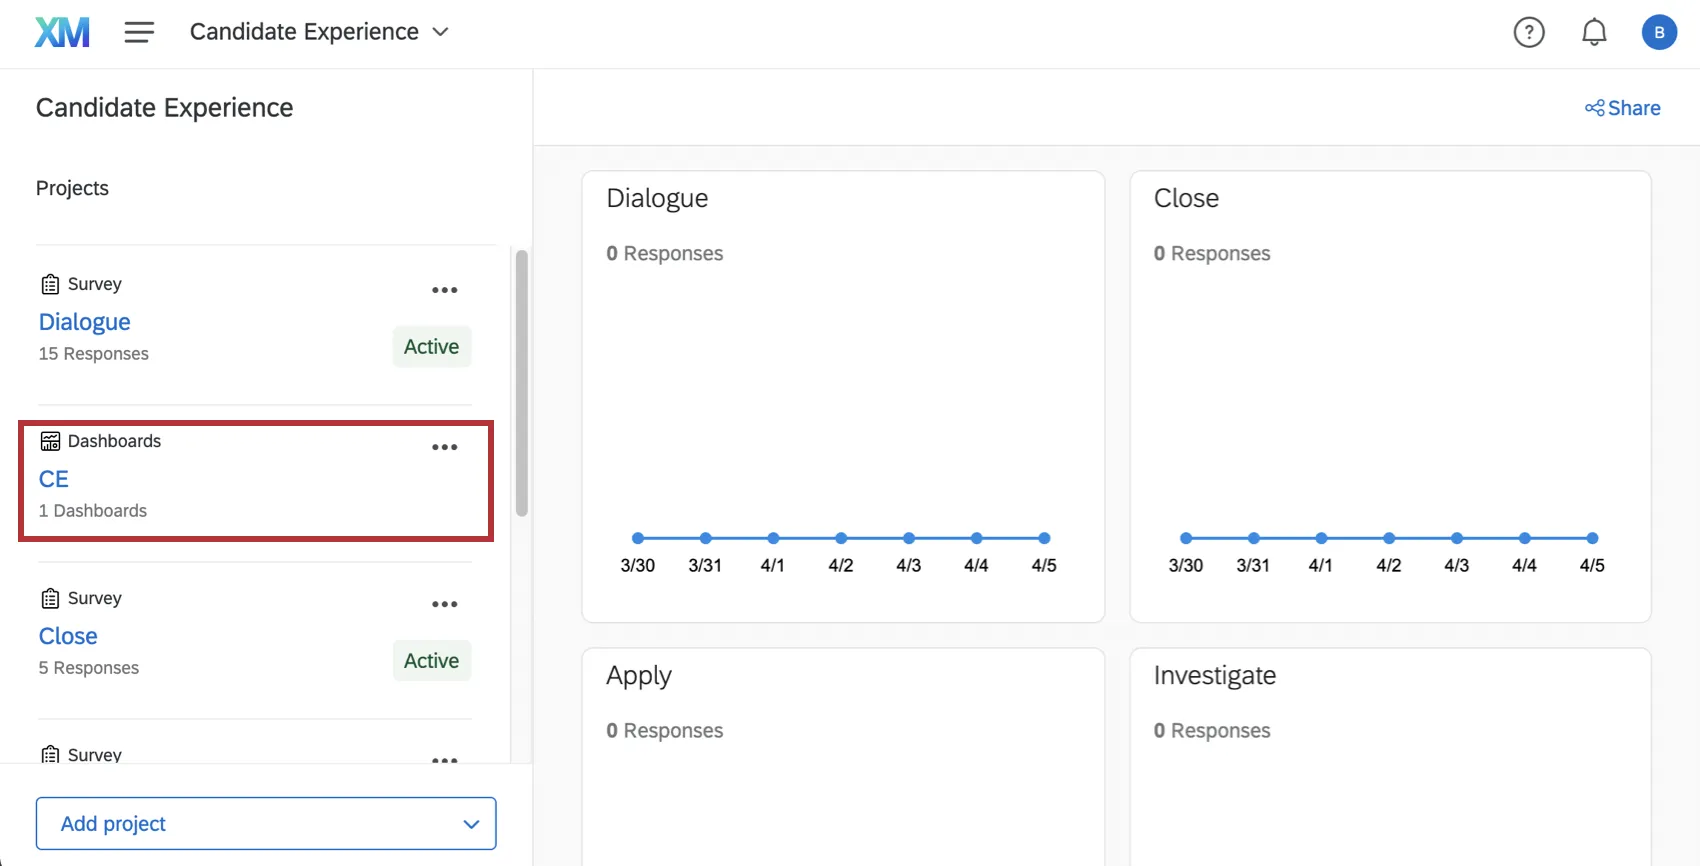
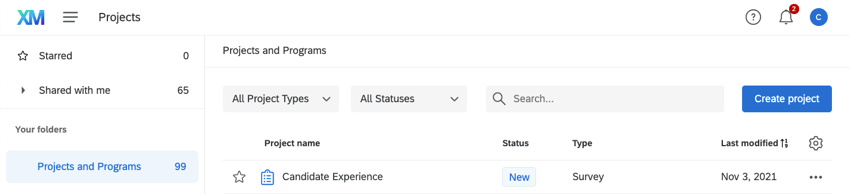
Your implementation consultant will create the Candidate Experience Program and collaborate with you to optimize it for your needs. Once your implementation consultant is finished creating this program, it can be found any time on the Projects page of your account.
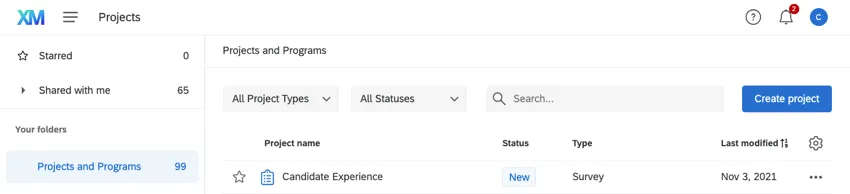
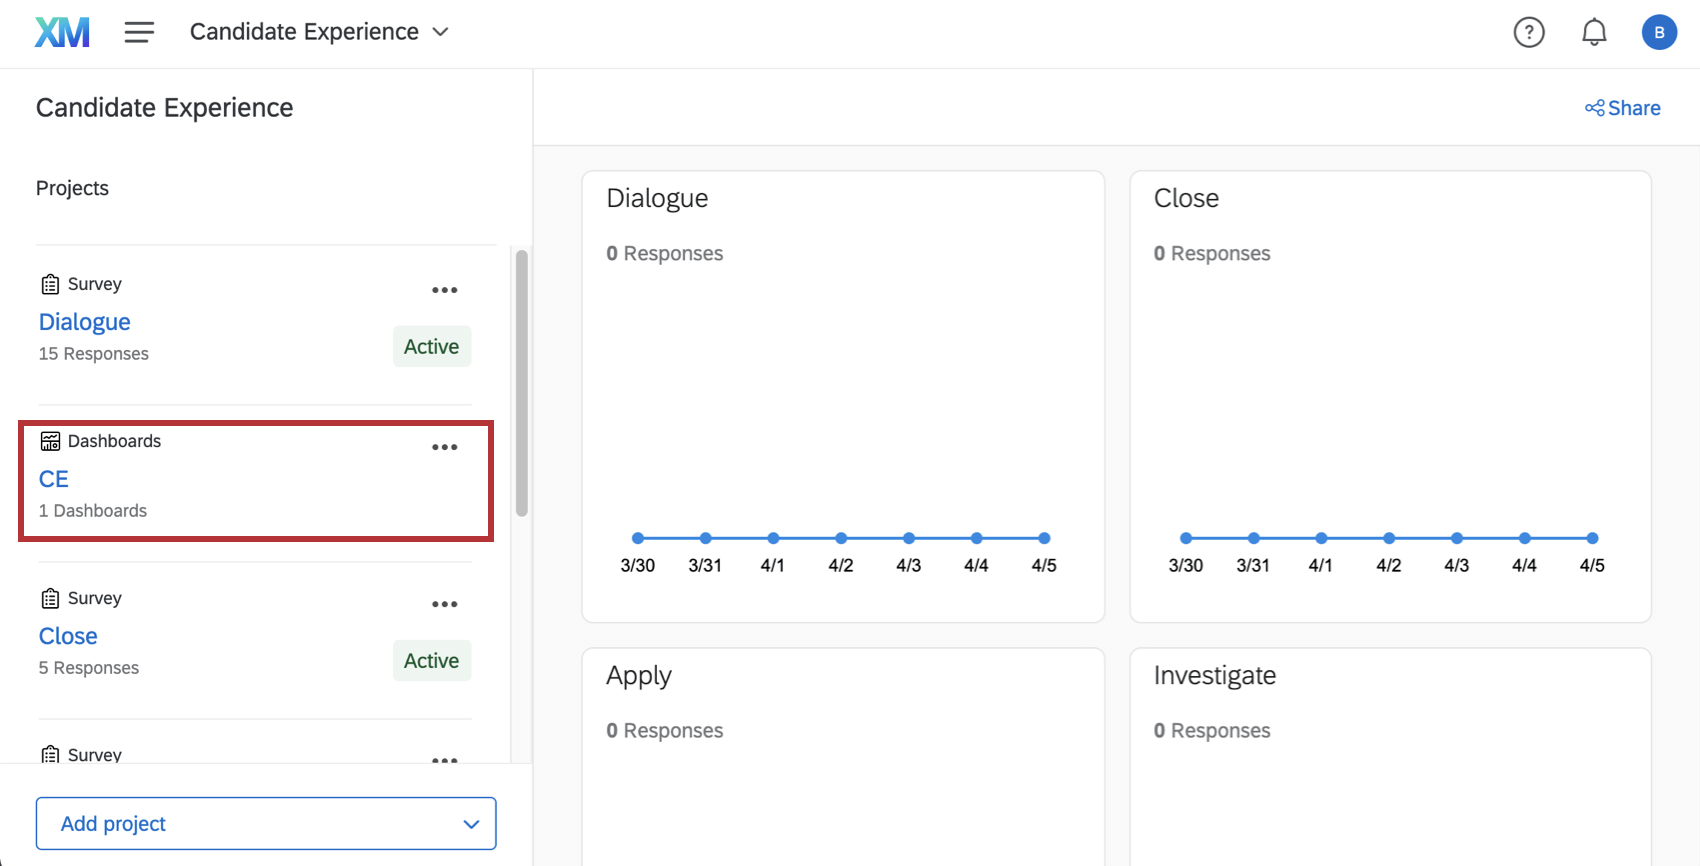
When you click the program’s name, you’ll find yourself on a page with the various resources we have developed to help you run your Candidate Program.
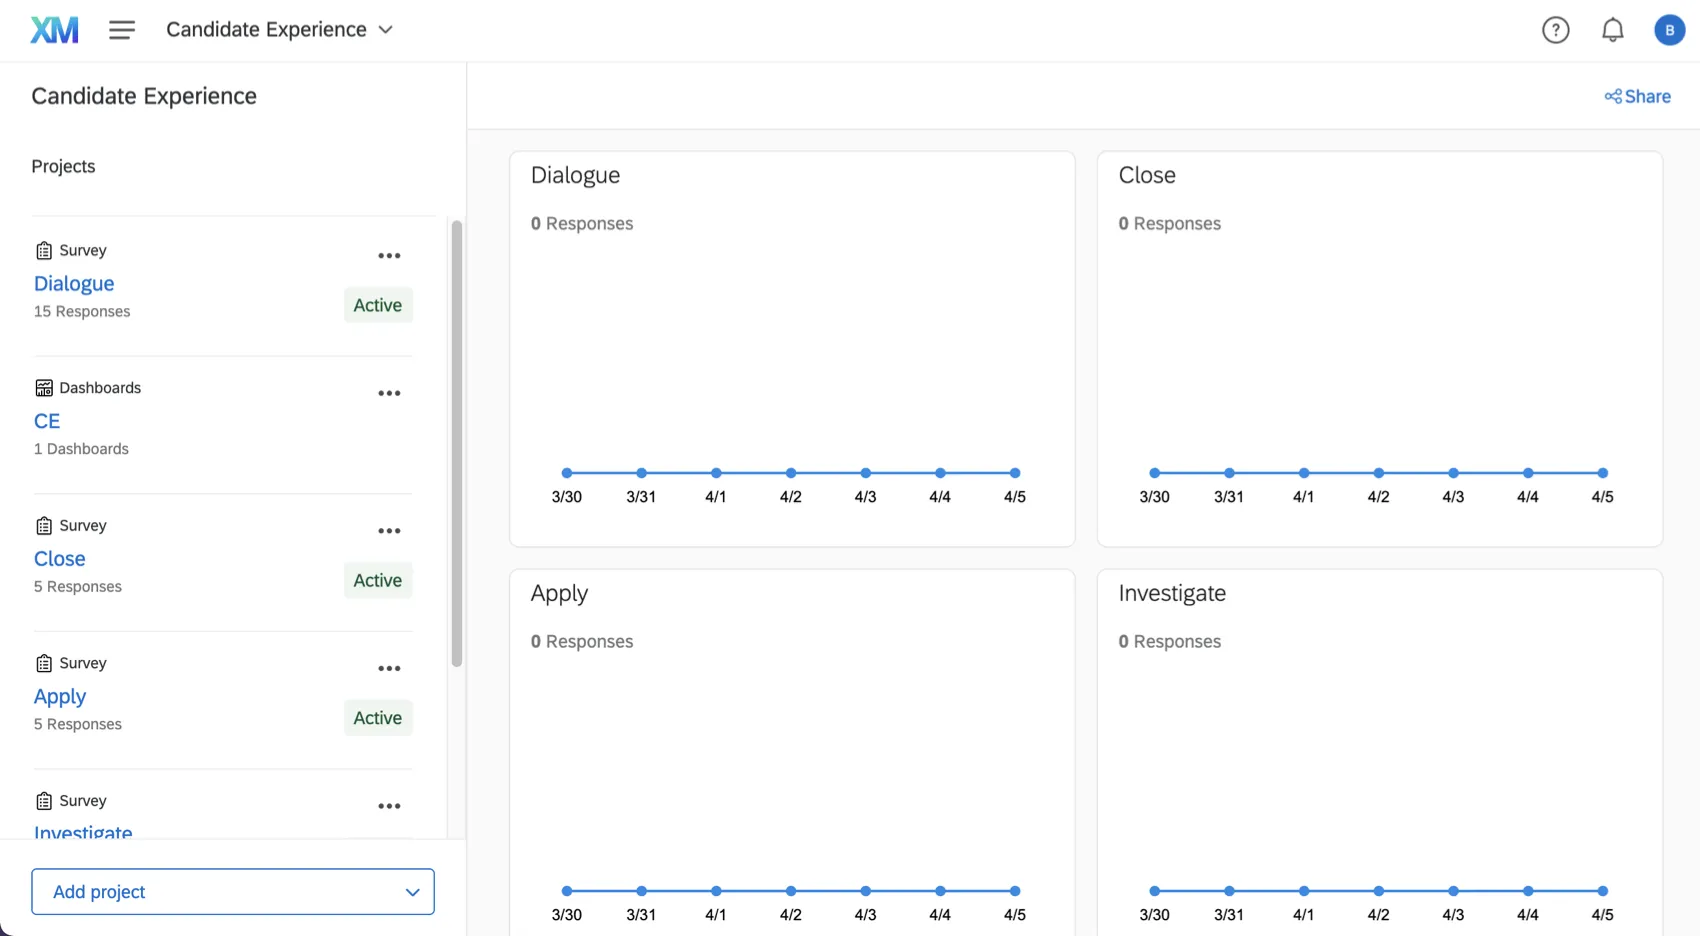
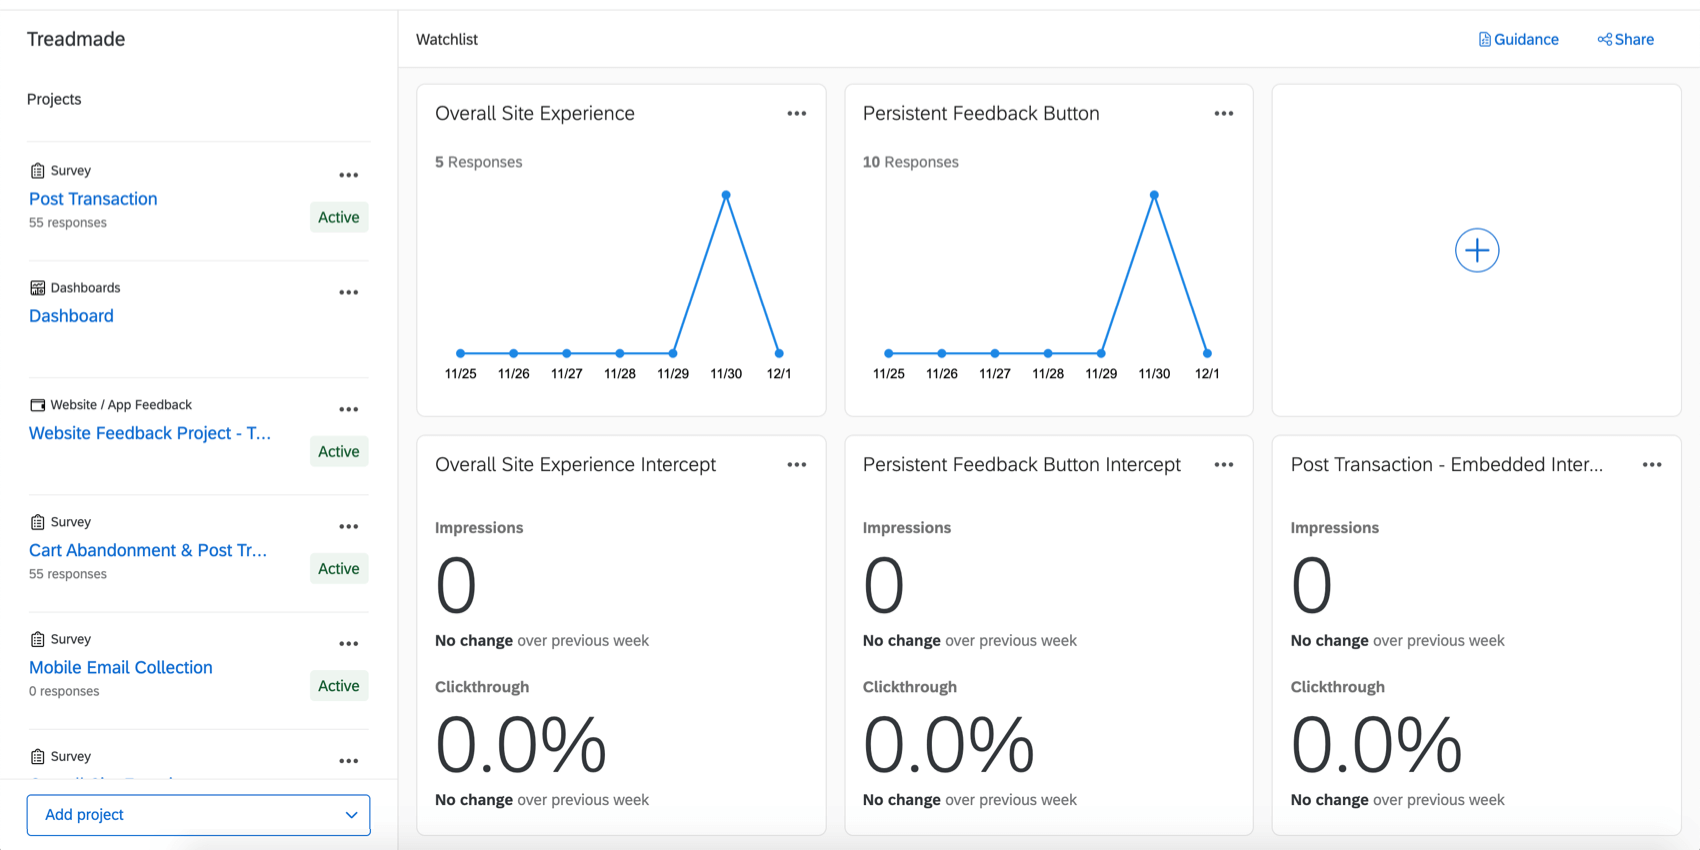
Several resources are included, which you’ll see listed on the left under “Projects.” These include:
Qtip: You can add and remove projects from this program.
In the center is a watchlist. This is a helpful place to keep track of response rates and click through rates without looking into individual resources.
To learn more about generally navigating a program, see the Programs support page.
Qtip: You can share this program with other users in your Qualtrics license.
Watchlist
The watchlist is a series of high level reports that help you gauge the status of your projects. There are 3 charts devoted to the number of responses that individual surveys collected over the last week and 3 devoted to clicks and impressions from Website / App Insights intercepts.
A chart cannot contain data from more than 1 project at a time. Clicks and impressions are from individual intercepts, not creatives or entire projects.
Qtip: For more advanced reporting, try dashboards. You can even add a dashboard within the program.

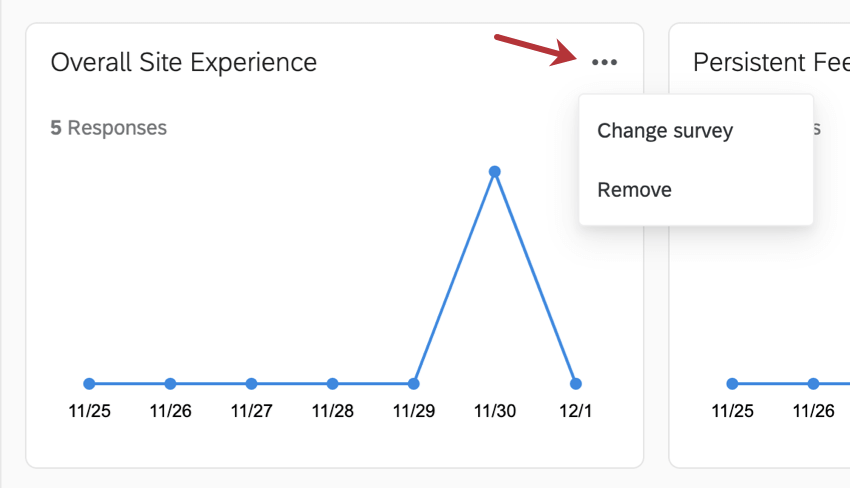
To edit a chart, use the dots in the upper-right. You can then either:
- Change survey/intercept: Depending on the type of chart, you can change the project whose data is being displayed in it. You cannot choose a project that isn’t inside the program.
- Remove: Remove the chart from the watchlist. When you do this, it will be removed for everyone you’ve shared the program with.
Adding Charts Back to the Watchlist
To add a chart to the watchlist, click the plus sign ( + ).

You can only add the same type of chart you removed. You cannot have more than 3 survey charts and 3 intercept charts.
Surveys
Your solution will include 4 to 5 surveys, each representing a different “stage” of the candidate’s journey. They are as follows:
Your implementation consultant will take care of much of the heavy-lifting when it comes to survey setup and customization. However, we’ve compiled a few resources to help you with common changes you may want to make later.
- Appearance and Theming: Customize the look and feel of the survey, including the theme.
- Editing Questions: Customize the questions. See Creating Questions, Formatting Questions, Formatting Answer Choices, and Validation for more. Example: In one question, we ask how the candidate found your organization’s job listing. You may wish to adjust these to take into account other channels through which you source candidates.
 Example: In another question, we ask what factors influenced a candidate’s decision to join the company. You may wish to adjust these to take into account unique factors to your candidate attraction.Qtip: Although there are several question types to choose from, best practice is to stick to simple multiple choice.
- Translations: Add translations to your surveys as needed.
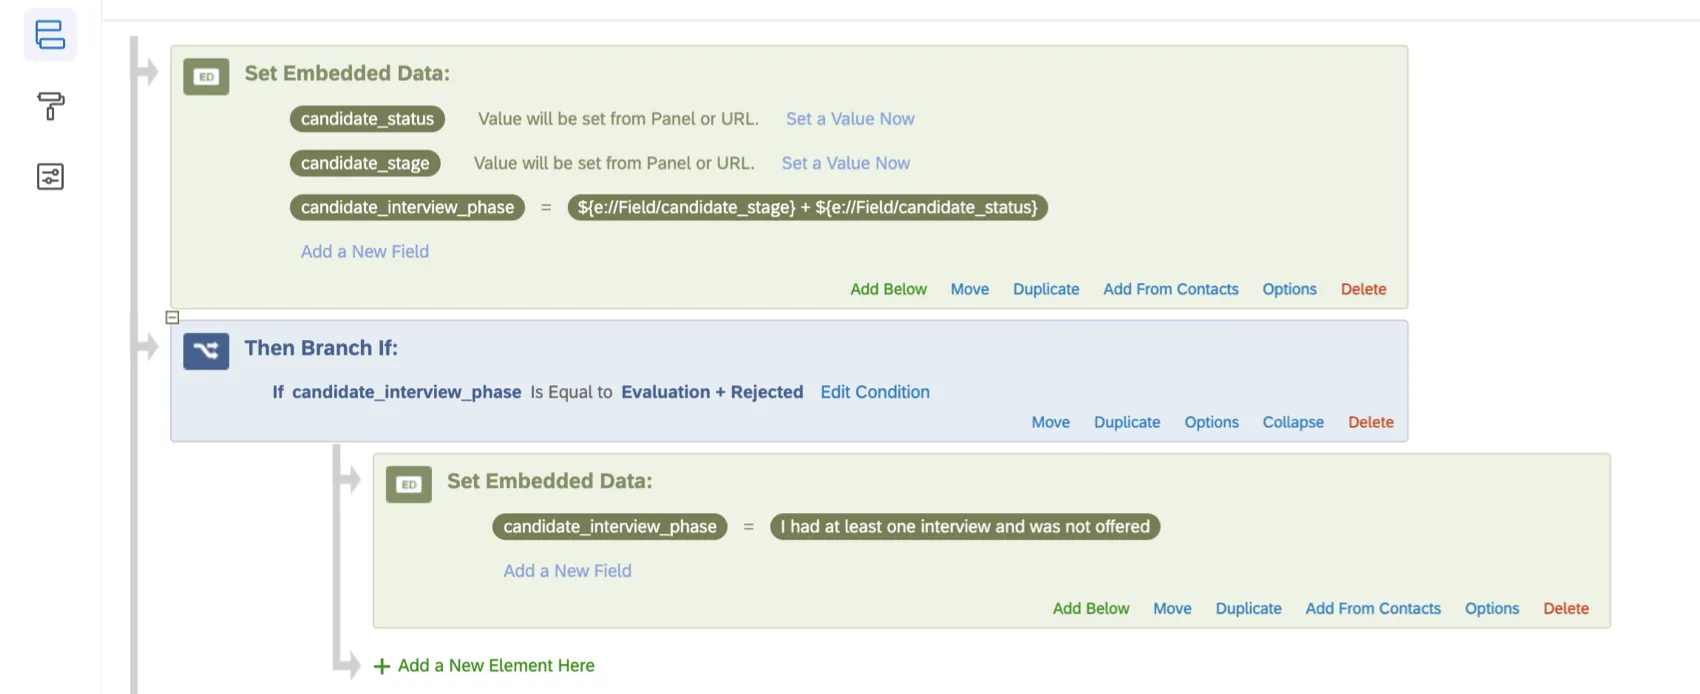
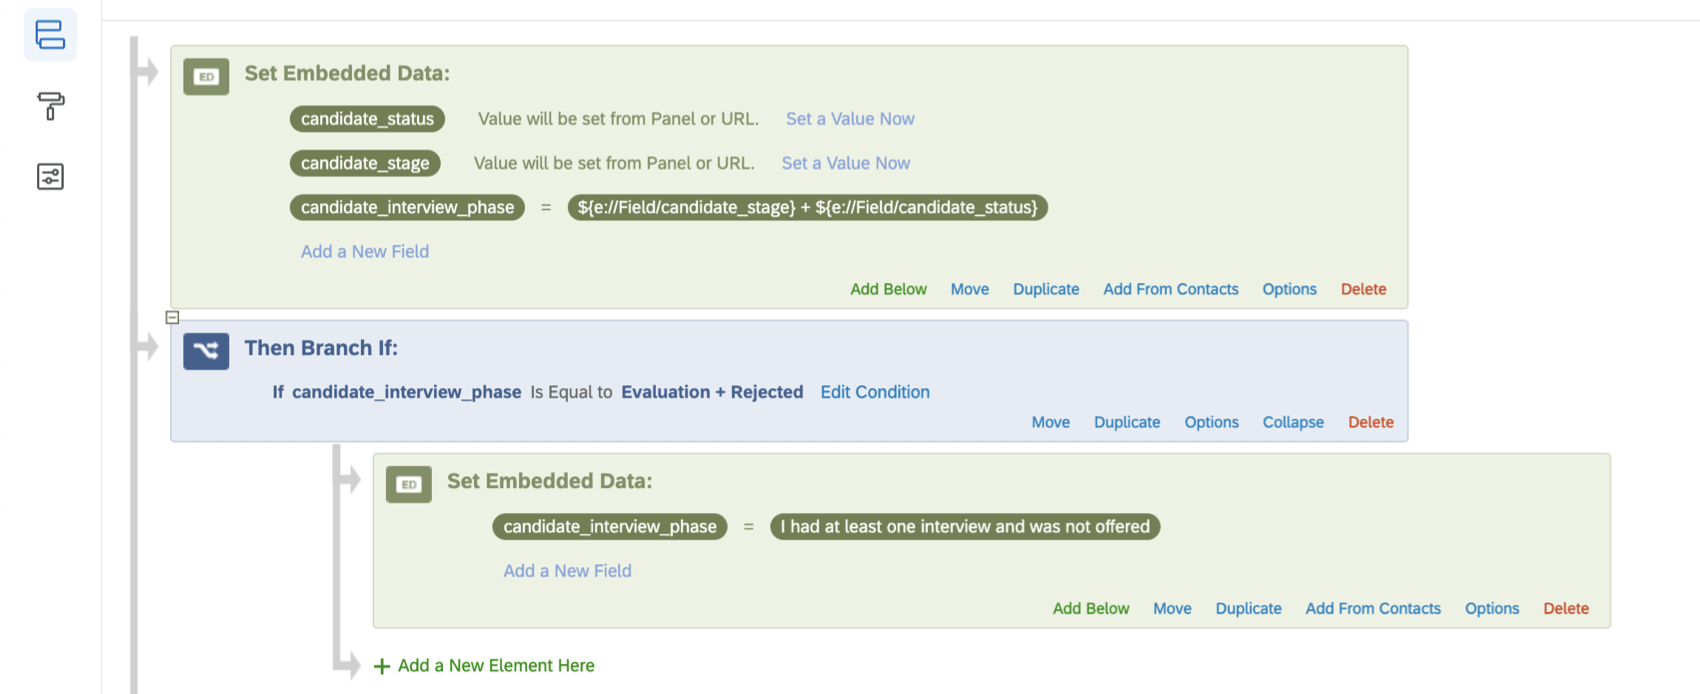
- Embedded Data: Your implementation consultant will add embedded data to the survey flow. The purpose of this is to capture the stages of the candidate’s journey, which you can learn more about in the next section of the page.
Attention: Do not edit or remove any of the preconfigured branches or embedded data in the surveys! If you do, this could negatively affect your data reporting. Embedded data naming in the survey flow must match the naming in automations (legacy), workflows, journey stages, and Website Insights logic (if applicable).
Make sure you preview your survey edits before you publish them. Always publish your surveys when you’re done editing them – this includes edits made to already live surveys.
Qtip: We recommend making sure all your surveys are finalized before you launch a program. For a guide to what edits are safe to make to surveys that have already collected data, see Testing/Editing Active Surveys.
Tracking the Candidate’s Journey
When implementing your program, you and your implementation consultant will have worked out a way to label candidates so you can better track their journey. This label should be defined automatically from your Applicant Tracking System. Every Applicant Tracking System is slightly different, but our solution has been built around stages that should be common to the vast majority. Labelling helps both in the set up of contact automations and when reporting data in dashboards.
Example: Every candidate has a “Stage” and a “Status.” Someone finished with interviews who is going to be hired might have a Stage of “Offer” (to indicate an offer has been made) and a Status of “Hired” once they respond in the affirmative.
As candidates progress into different phases of their journey, their stage and status will change. This change will be used to qualify them for the appropriate survey and act as a trigger for distribution.
For more on how this is set up in Qualtrics, see Defining an Experience Journey. For its impact on survey design, see Configuring Dashboard Data for Journeys.
Distribution of Candidate Experience Surveys
The surveys included in this program will generally be distributed through a couple types of workflows. This allows you to automate contact uploads and survey distributions to work on a schedule, without you having to manually perform tasks every time.
Qtip: You can create this workflow in your global workflows, directory workflows, or in the Workflows tab of one of the program’s surveys.
Contact import workflows and Transaction Data
For your first workflow, follow these steps to create a contact import workflow, with 2 important differences:
- Add every contact to the same contact list. We recommend creating a candidate mailing list in your directory before you make your workflow.
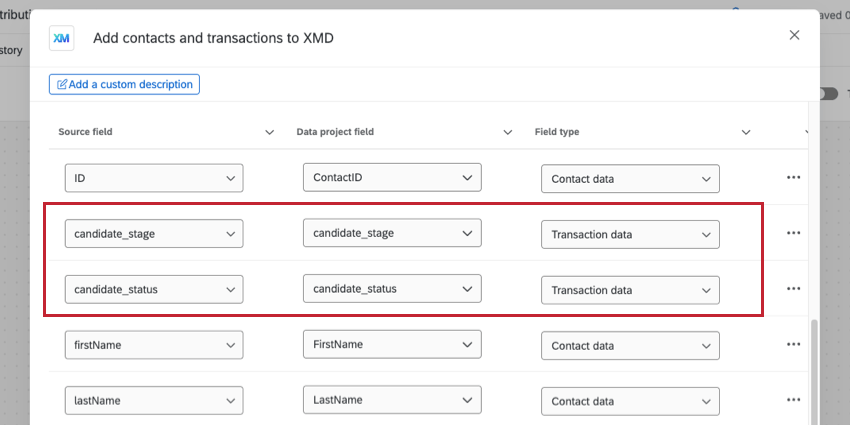
- Map candidate fields, like stage and status, to transaction data.
To elaborate on the second part: when you load data to XM Directory, contact-identifying fields should be mapped as Contact Info. However, for your other optional, custom contact fields, we recommend using transaction data, not embedded data.
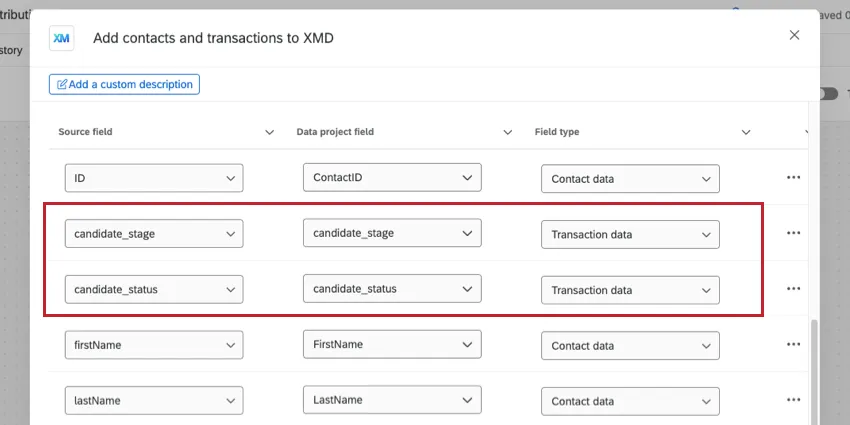
Transactional data is used to store contact information in XM Directory in a different way than embedded data. In the context of this program, it is a way to store the relevant candidate fields as individual interactions on the same contact rather than overwriting the embedded data on the contact each time the contact is updated.
Qtip: When choosing what files to upload to XM Directory, target files that only show candidates who have changed since the last workflow was run.
Qtip: Embedded and transactional field naming in workflows must match the naming in the survey flow, journey stages, and Website Insights logic (if applicable). We do not advise changing embedded data in a program that is actively collecting responses.
Distribution workflows
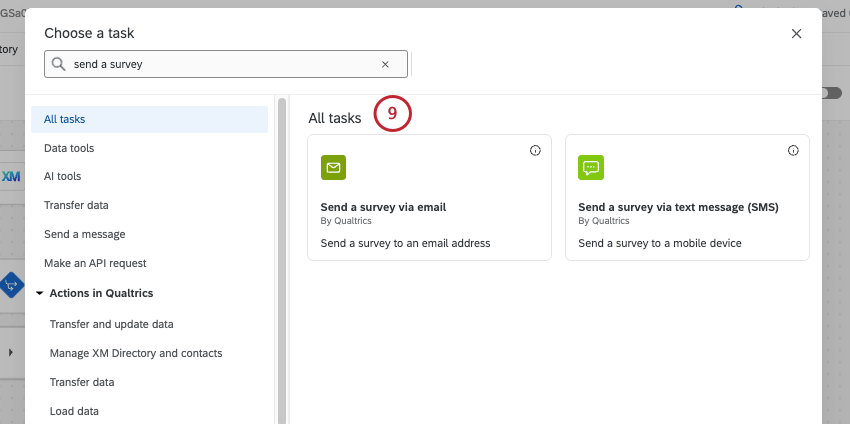
Now that your contact import workflow is set up, now you’ll create a distribution workflow. You can choose whether you’d prefer to have all distributions in one workflow or separate workflows for each survey (i.e., each stage) in the Candidate Experience program. If you choose to do just one workflow, you’ll need an email/SMS task for each survey.
Keep in mind that your program’s setup may vary from what we describe in the examples below.
Qtip: When troubleshooting, you’ll want to review the agreed upon stages of the candidate journey.
Qtip: We recommend uploading example data to your directory before completing these steps. This is to ensure any candidate data fields you want to use already exist in your directory.
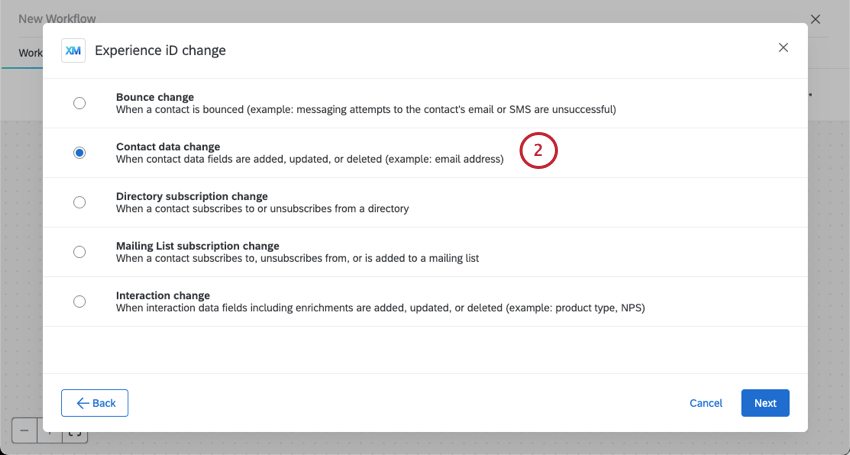
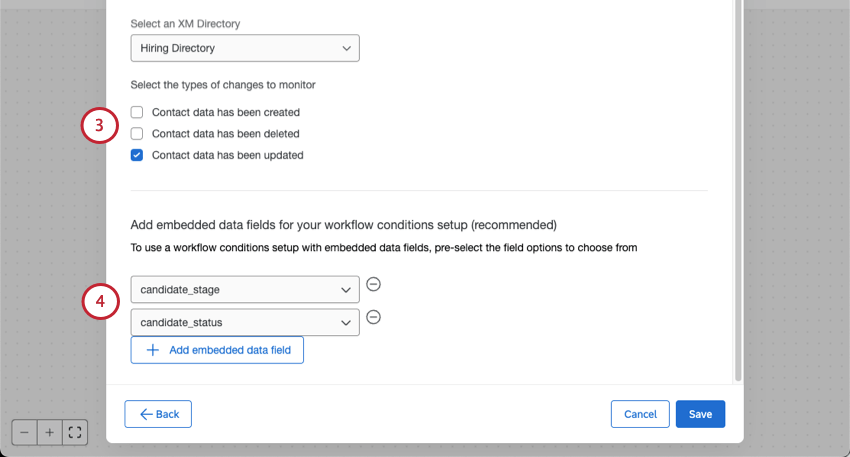
- Candidate status
- Candidate stage
- Any other information you want to include in criteria or the email message Qtip: Main contact data will carry over automatically, but due to the sheer amount of embedded data fields that can exist in a directory, you need to select the specific ones you want to use in the workflow.
Qtip: Read more about creating conditions for experience change ID events.
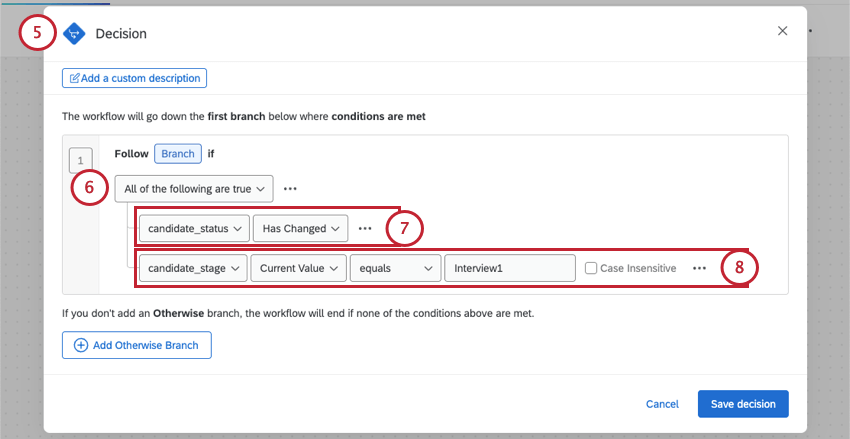
Example: You’re creating a workflow for the first interview phase. When candidates enter this phase, you mark their “candidate_stage” as “Interview1”.
Qtip: Read more about piped text.
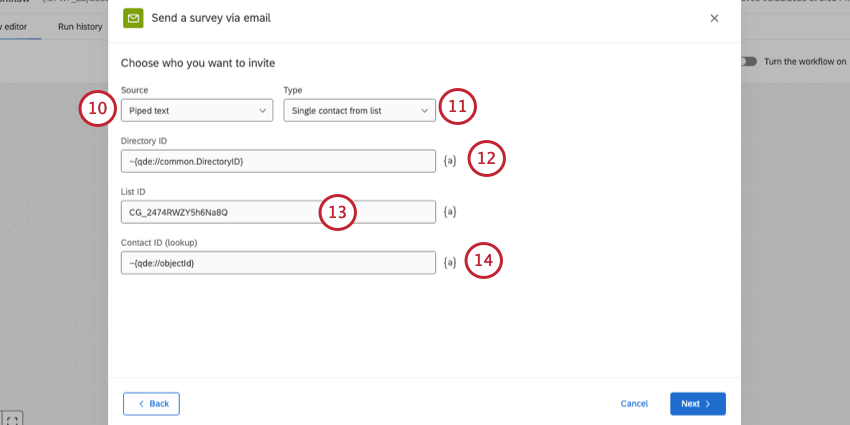
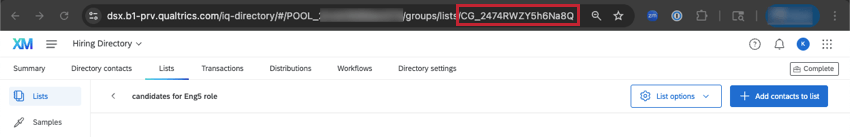
Qtip: You can find the ID of a list when you open it and look at the URL. Contact list IDs tend to be in the format of CG_XXXXXXX.

If you want to include all distributions in the same workflow, you can repeat steps 5-15, creating a condition and a task for each stage.
Keep in mind that if you use separate workflows instead, you can copy workflows to work faster when you create conditions and distribution tasks.
CONTACT FREQUENCY
How often should candidates be contacted? Let’s imagine a single candidate applies to 5 jobs in 1 day. Should they receive a single Apply survey invitation, or should they receive 5? What if that same candidate applies to a job a month later? Should they receive another survey invitation about their application experience? You can customize these settings by creating Custom Rules in the XM Directory.
Our recommendation is to set some contact frequency parameters by stage:
- Post-Application: Apply contact frequency rules so you only get 1 post application survey every 90 days (regardless of how many roles you apply for). Note that the 90 day rule can be extended/shortened.
- Post-Screening: Our default recommendation is to not apply contact frequency rules, meaning a survey is deployed for every candidate that passes post-screening for every role. Some organizations may prefer to apply contact frequency rules so there is only 1 post-screening survey every 90 days.
- Post-Interview: We do not recommend applying contact frequency rules. Each interview experience will be different so it’s important to collect feedback on all of them, and candidates are additionally unlikely to receive a high-volume of these. Note – our standard solution includes 1 touchpoint at the end of the interview phase rather than after every interview.
- Post-Offer: We do not recommend applying contact frequency rules. Each offer experience could be different so important to collect each one. It is very unlikely for candidates to receive high-volume of these in a given period.
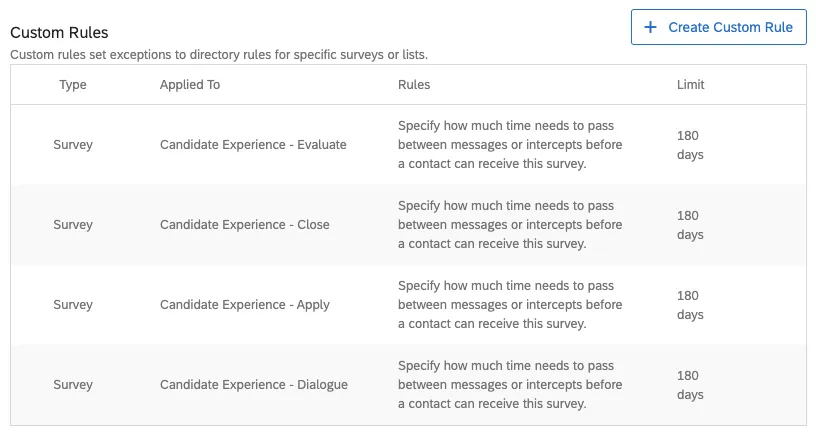
Example: In the screenshot below, a candidate can be sent each survey once every 6 months, or 180 days.

Keep in mind how you’ve chosen to track the candidate’s journey. Does each application submitted create a net-new candidate ID in the system, or does the system consolidate each candidate’s information, storing all job applications under 1 candidate ID and differentiating applications by a job ID? Answers to these questions may impact the settings of your contact frequency.
Website / App Insights
Qtip: Not all Candidate Experience Programs will incorporate this functionality, depending on the needs of your organization and the capabilities of your career website.
If your organization has an employee career site to leverage for feedback, this can be incorporated into your larger Candidate Experience Program. Your implementation consultant will take care of much of the setup, but you will need to be in contact with your organization’s web development team in order to deploy the code to your website.
It is worth noting that experience feedback collected on the career site will be anonymous – that is, user data will not be tracked and will not be able to link to subsequent touch-points in the candidate experience.
This section contains key resources divided by user intent: those looking to edit a Website / App Insights project (the appearance and behavior of the digital touchpoint), and those in web development positions looking to implement the code. More resources can be found if you search this site.
Resources for Customizing the Website / App Insights Experience
- Getting Started with Website / App Insights
- Step 1: Preparing Your Targeted Survey
- Step 2: Creating a Website / App Insights Project
- Step 3: Building Your Creative
- Step 4: Setting Up Your Intercept
- Step 5: Testing & Activating Your Website / App Insights Project
Additional resources and advanced options:
- Multiple Action Sets
- Embedded Data in Website / App Insights Qtip: Be careful when editing any pre-configured embedded data. If you remove or rename fields, you will not capture the desired information.
- Intercept Options
Resources for Web Developers
Qtip: If possible, we recommend testing project code on the staging version of your website before pushing changes to production.
Dashboard
Premade Dashboard
Our EX Product Science team has developed a dashboard template for this program. This dashboard is designed to quickly allow recruitment teams and leaders to understand their top priorities to have the most positive impact on their candidate experience. It will be is ready to share as soon as you have collected data.
When you’re ready, this dashboard can be found in your program’s project list.
Qtip: This dashboard will not generate charts and tables until you collect data. Try completing 1 or more of the surveys through the preview button if you want to test what these dashboards look like with data. Remember you can always delete preview data later.
Qtip: Line charts may appear as a single point until you collect multiple weeks worth of data. This is because they are displaying trends over time, and don’t have enough data to display a trend yet.
Dashboard Editing
Qtip: The pre-made dashboard was developed by our top subject matter experts. We advise trying to keep your dashboard as similar to the original template as possible, and not making too many large-scale changes.
Check out these introductory pages to get started.
- Getting Started with CX Dashboards
- Step 1: Creating Your Project & Adding a Dashboard
- Step 2: Mapping a Dashboard Data Source
- Step 3: Planning Your Dashboard Design
- Step 4: Building Your Dashboard
- Step 5: Additional Dashboard Customization
- Step 6: Sharing & Administering Users
Qtip: Once you’ve uploaded all your dashboard users, you can easily send many / all users their login credentials.
Features Included with the Candidate Experience Dashboard
The Candidate Experience dashboard was built to best support the candidate use case. It is modeled off our CX Dashboard technology, which differs from the dashboards you might find in EX projects, such as Lifecycle or Engagement. As such, the support resources we link below link to CX Dashboard documentation, which will cover the Candidate Experience dashboard as well.
Dashboard settings:
- Dashboard data Qtip: This is where all your survey and journey data is configured so you can report on it. If you add questions to your surveys without your implementation consultant, make sure to add them to your dashboard.Qtip: For CSAT fields, recode values should generally be 1 to 5, most negative to most positive.
- Notifications
- User admin
- Translation
- Text
- Theme
- Custom metrics Qtip: Custom metrics enable you to build custom use-case metrics and use the Respondent Funnel.
Widgets:
- Line & Bar Chart Widgets
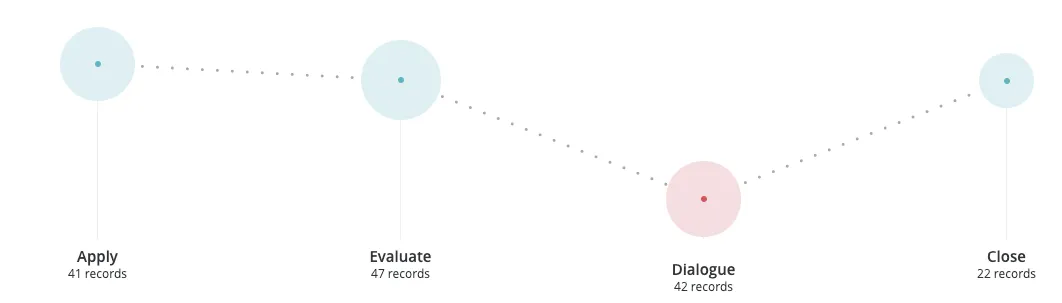
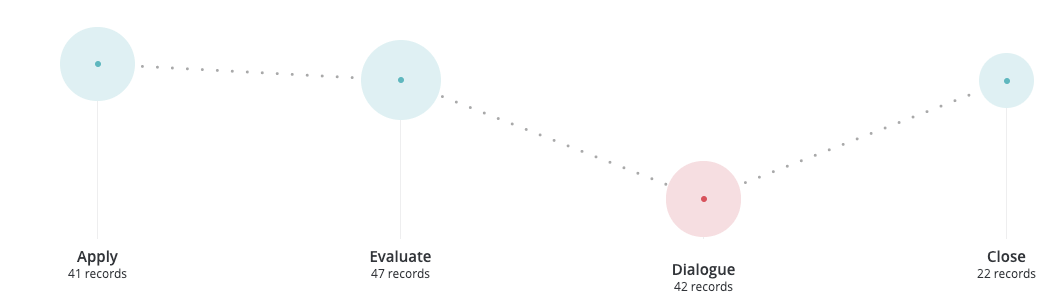
- Journey chart Qtip: This widget is especially important for reporting on candidate stages.
- Donut / Pie Chart Widget
- Gauge chart
- Number chart
- Table Widget
- Record Table Widget
- Key drivers
- Image
- Rich text editor
- Word cloud
- Response ticker
- Text iQ bubble chart
Qtip: Any widget displaying a percentage or a favorability score is configured using top box / bottom box metrics to display data. Favorable scores are those with a response value of 4-5. This is displayed as the box range.
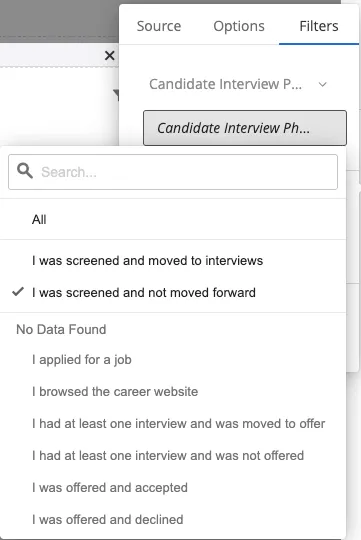
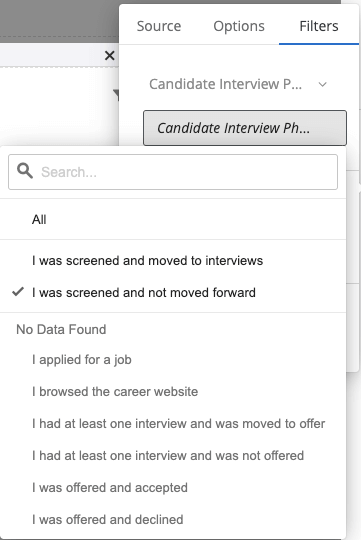
Qtip: When widgets display data based upon the candidate’s stage, or if they were successful vs. unsuccessful, there will be a filter configured in the Top Box / Bottom Box metric. For example, on the “Stage 3 – Evaluate” page, for candidates screened out the metric is configured as shown in the image below.
Qtip: If fields are renamed (such as in the survey flow or action set logic), the metric filters will likely need to be reconfigured in the dashboard.
Other:
Qtip: Page filters are locked for pages that are supposed to only show data from a single survey. There is 1 page configured that is specific to each data source.
Reconfiguring a Program
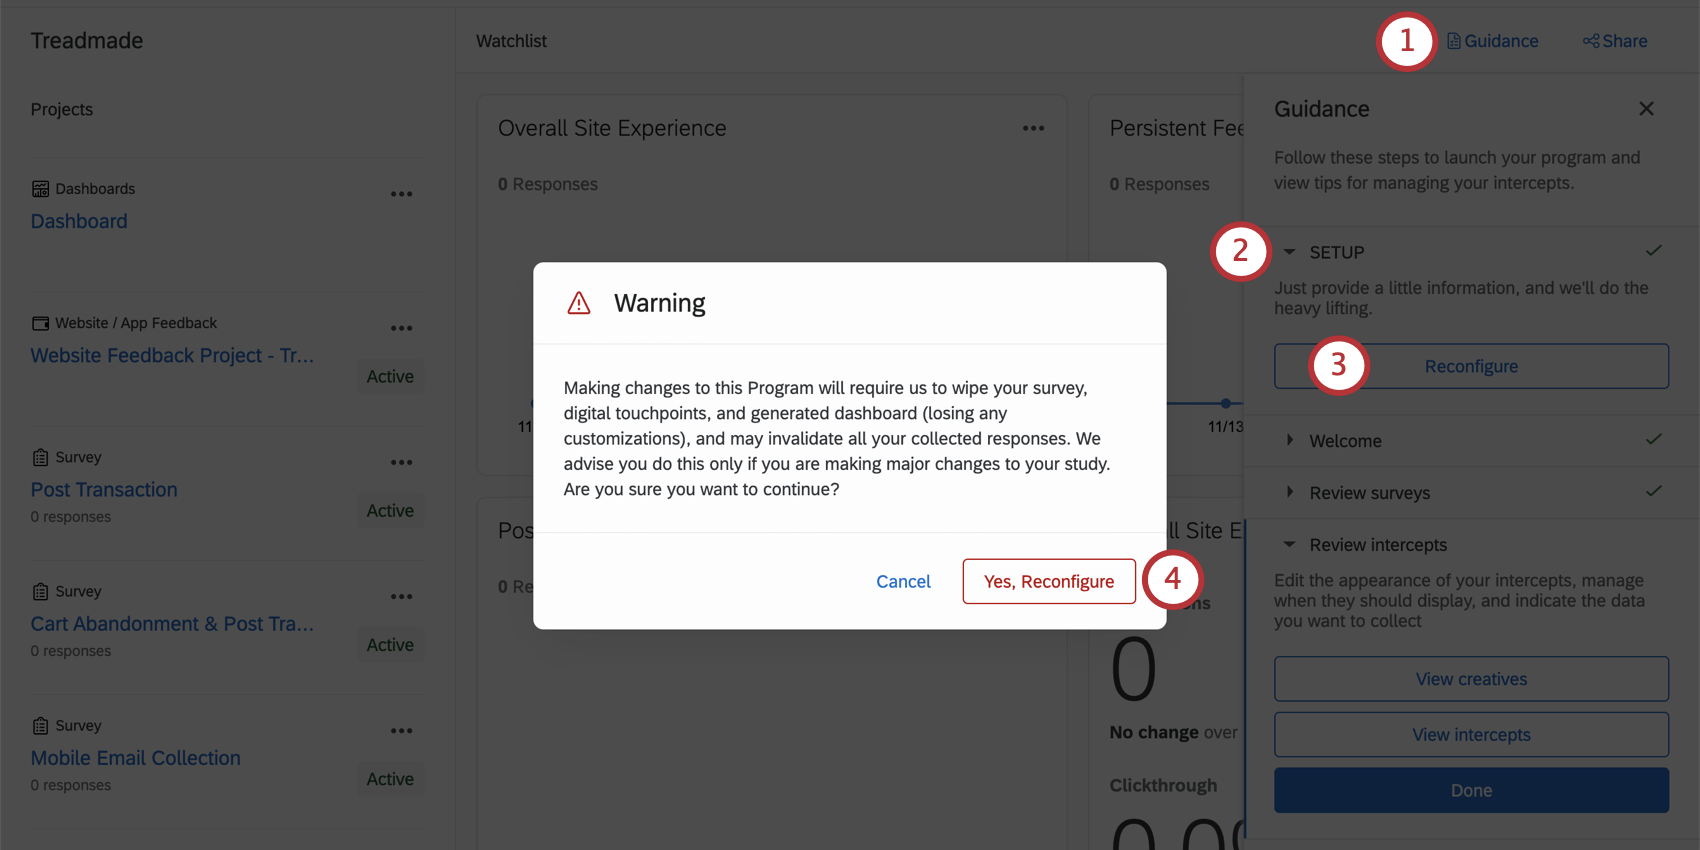
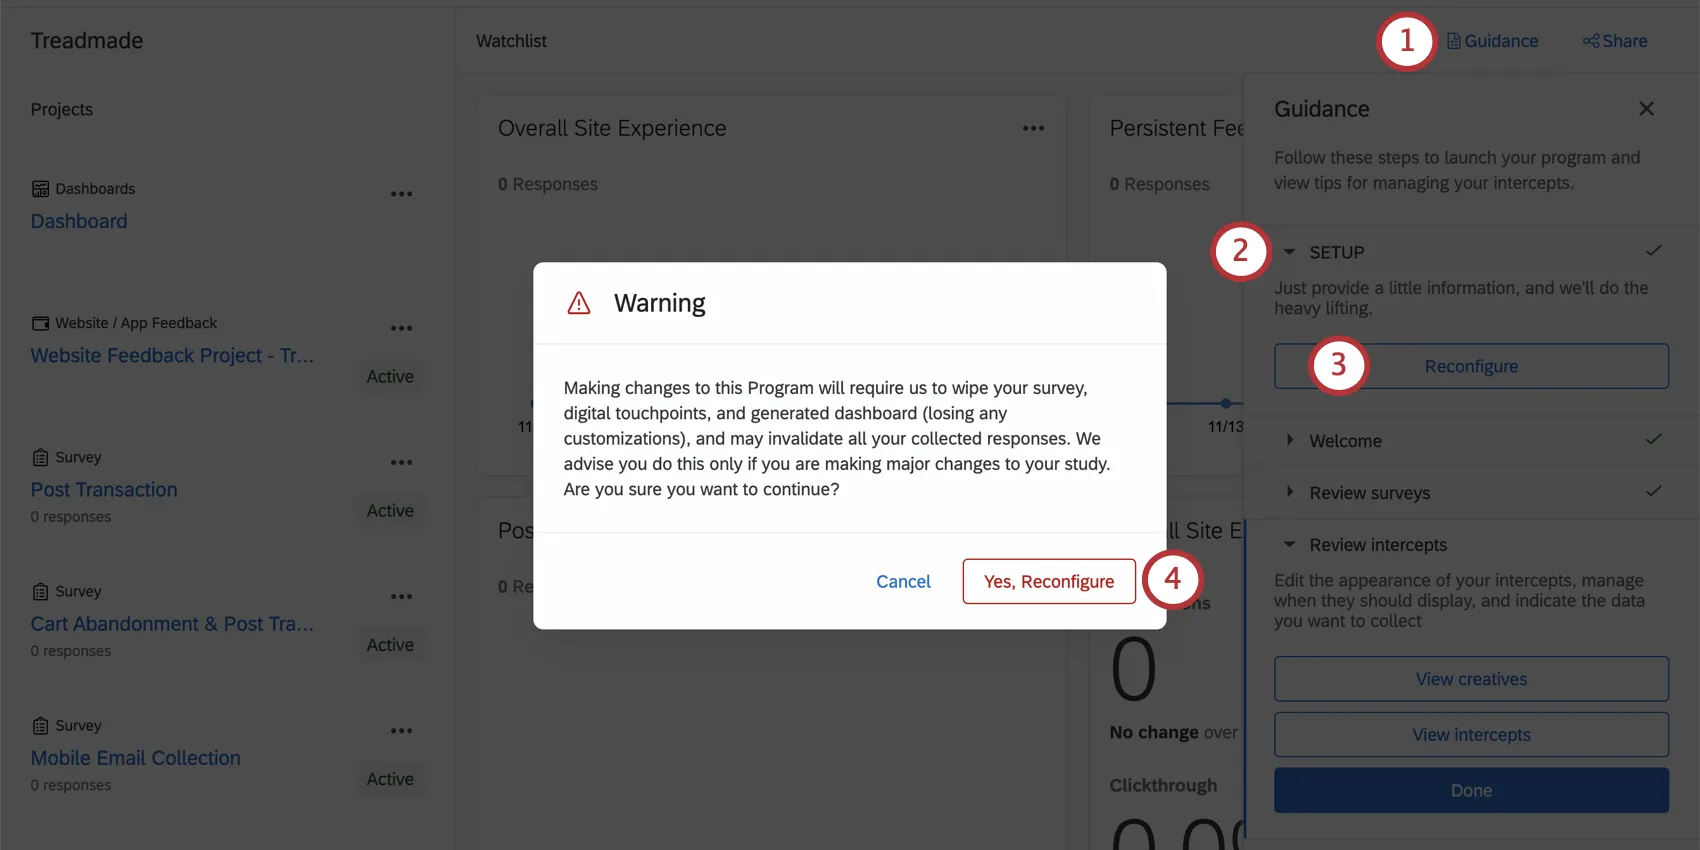
Once your program or guided project is created, you can individually edit the different parts as needed. We recommend doing this instead if you’ve already starting collecting data or deployed code to your website. However, if you want to completely start over from scratch, follow these steps.
Warning: Reconfiguring this program will wipe the survey structure, custom dashboard, creatives, and intercepts. Because of this, all previous surveys, survey data, dashboards, creatives, intercepts, and associated deployment code will be erased. You should only reconfigure your program if you are absolutely sure you want to risk losing everything you’ve generated, including the code used to deploy the project on your website.
That's great! Thank you for your feedback!
Thank you for your feedback!