-

Qualtrics Platform -

Customer Journey Optimizer -

XM Discover -

Qualtrics Social Connect
Gauge Chart (Results)

About Gauge Charts
Gauge Charts can help you quickly determine how a given question or response field is performing versus how it is expected to perform. With a Gauge Chart, you choose a data source and then select an aggregate metric you want to evaluate (mean, sum, etc.). The visualization displays that metric along a scale that changes color according to where your metric falls.
Customization Options
For general settings, see the Visualizations Overview support page. Read on for settings specific to the Gauge Chart.
Value Ranges
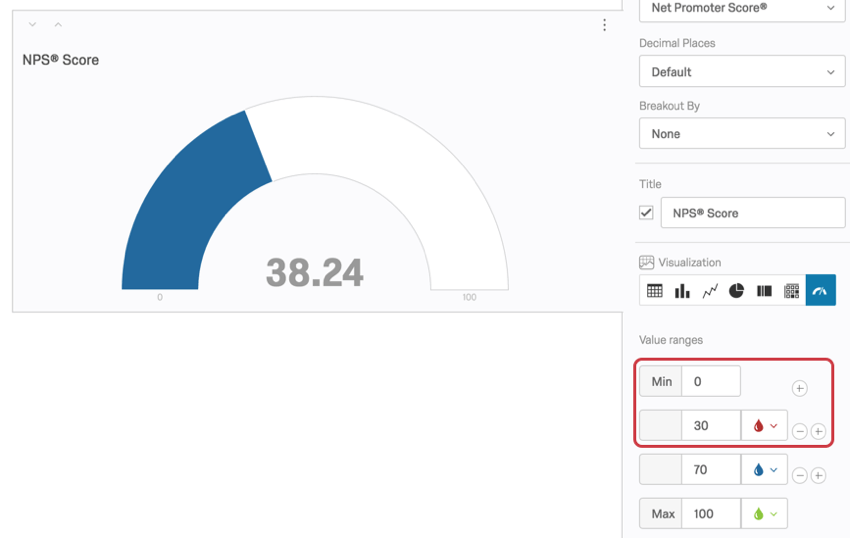
When setting up your Gauge Chart, you’ll first want to set your Min and Max values. What is the lowest value your metric should be? What is the highest? For example, on a ten point scale, 1 would be the minimum, and 10 is the maximum.
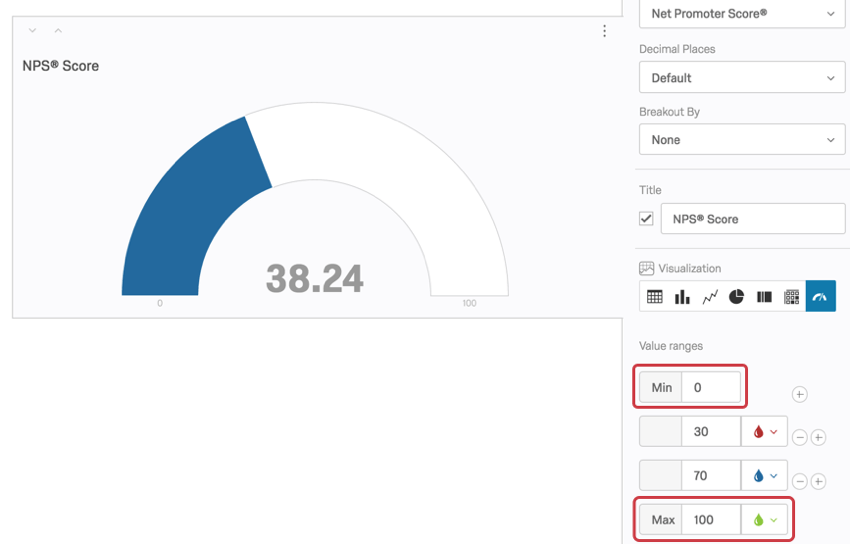
Once you’ve set those values, you can then create all the ranges that are relevant for your Gauge Chart. Delete values by clicking the plus ( + ) and minus ( – ) signs to the right of the ranges. These values are the maximum for that range – for example, any value below 30 will be red, but 30 will be blue.
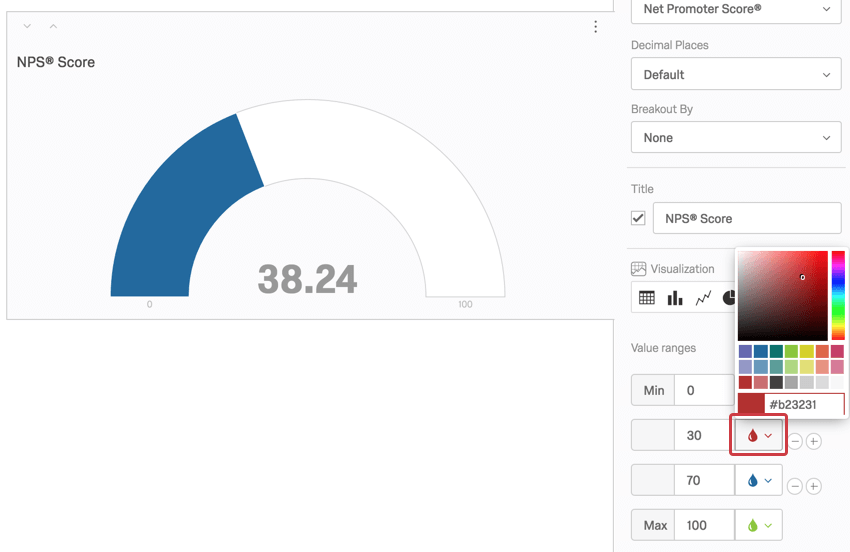
Range Colors
Each value range for your Gauge Chart has an associated color. You can tell which color is associated with which range by looking at the visualization editing pane.
To change the color for a given range, click the color dropdown and select a new color.
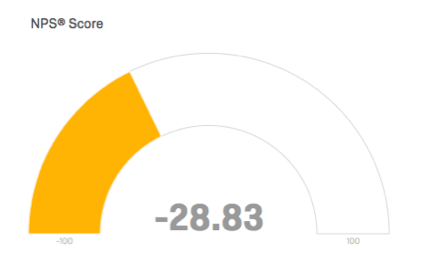
NPS Metric
If you set the Metric to Net Promoter Score®, the gauge chart will automatically configure its range to a minimum of -100 and a maximum of 100.
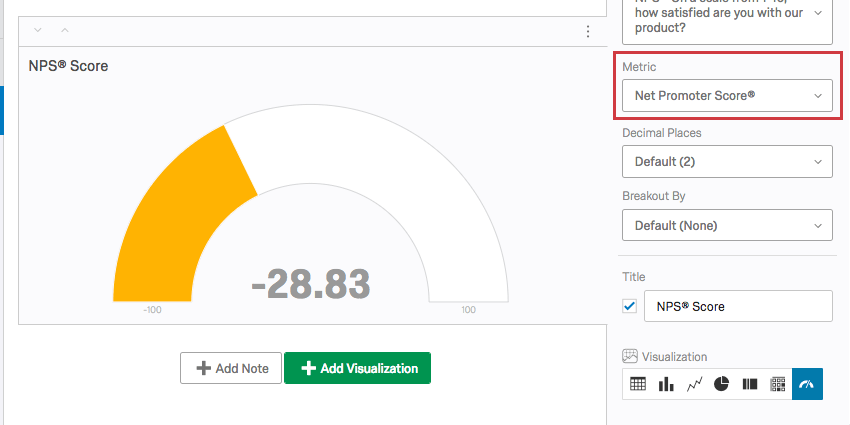
This is because the gauge is calculating a Net Promoter Score®. The best Data Source for a Gauge Chart with an NPS Metric is a Net Promoter Score® question. See the linked page for more details on setting these questions up and for help understanding the calculations behind the score.
The Net Promoter Score® Metric can be set for other multiple-choice questions, but does not make as much sense conceptually. It will function best with multiple choice questions that have 11 point scales recoded from 0-10.
Compatibility
The Gauge Chart is only compatible with variables that can come in numeric formats.
- Single-Answer Multiple Choice
- Net Promoter Score
- Single-Answer Matrix Table
- Bipolar, Rank Order, Profile, Constant Sum, and MaxDiff Matrix Tables
- Text Entry with Numeric Validation
- Form field question with numeric validation
- Open text fields on other questions, such as Text Entry Matrix Tables, text entry columns on Side by Sides, and “Other” text boxes, that have numeric validation
- Side by Side
Qtip: There should be multiple-choice single-answer column, or a text entry column with numeric validation.
- Slider
- Rank Order
- Constant Sum
- Pick, Group, and Rank (Individual groups, not all at once)
- Graphic Slider
- Drill Down
- Number and Number Set Embedded Data
- Formulas
- Numeric manual variables